
Cabral Gold (CBR.V): A 2-Phase Plan to Fund an Entire District
First gold in Q4-26. The market pays for the mine. The 306 km² district around it? Only tens of millions.

Cabral Gold is a pre-revenue company sitting on a potential gold district, with a plan to fund itself out of a first phase of production slated for Q4-26. (I can’t make it any shorter. I swear.)
The slightly-less-short version: Cabral Gold goes into production in a few months and will use part of that cash flow to drill the 50 targets across its Cuiú Cuiú district (Brazil) and to prepare a PEA (Preliminary Economic Assessment, the first economic study of a deposit) in 2027, for a mine on a much bigger scale.
So what we have is a developer one step from becoming a producer, and at the same time an explorer with a lot of targets to drill and potentially a lot of discoveries ahead.
That parks the company in the two moments on the Lassonde curve that offer the most re-rating. For the uninitiated, the Lassonde curve is the valuation path a miner follows over its life. Think of it as what the “laws” of economics and psychology do to a miner. The two big re-rating phases come after a significant discovery and on the approach to production. Precisely where Cabral sits.
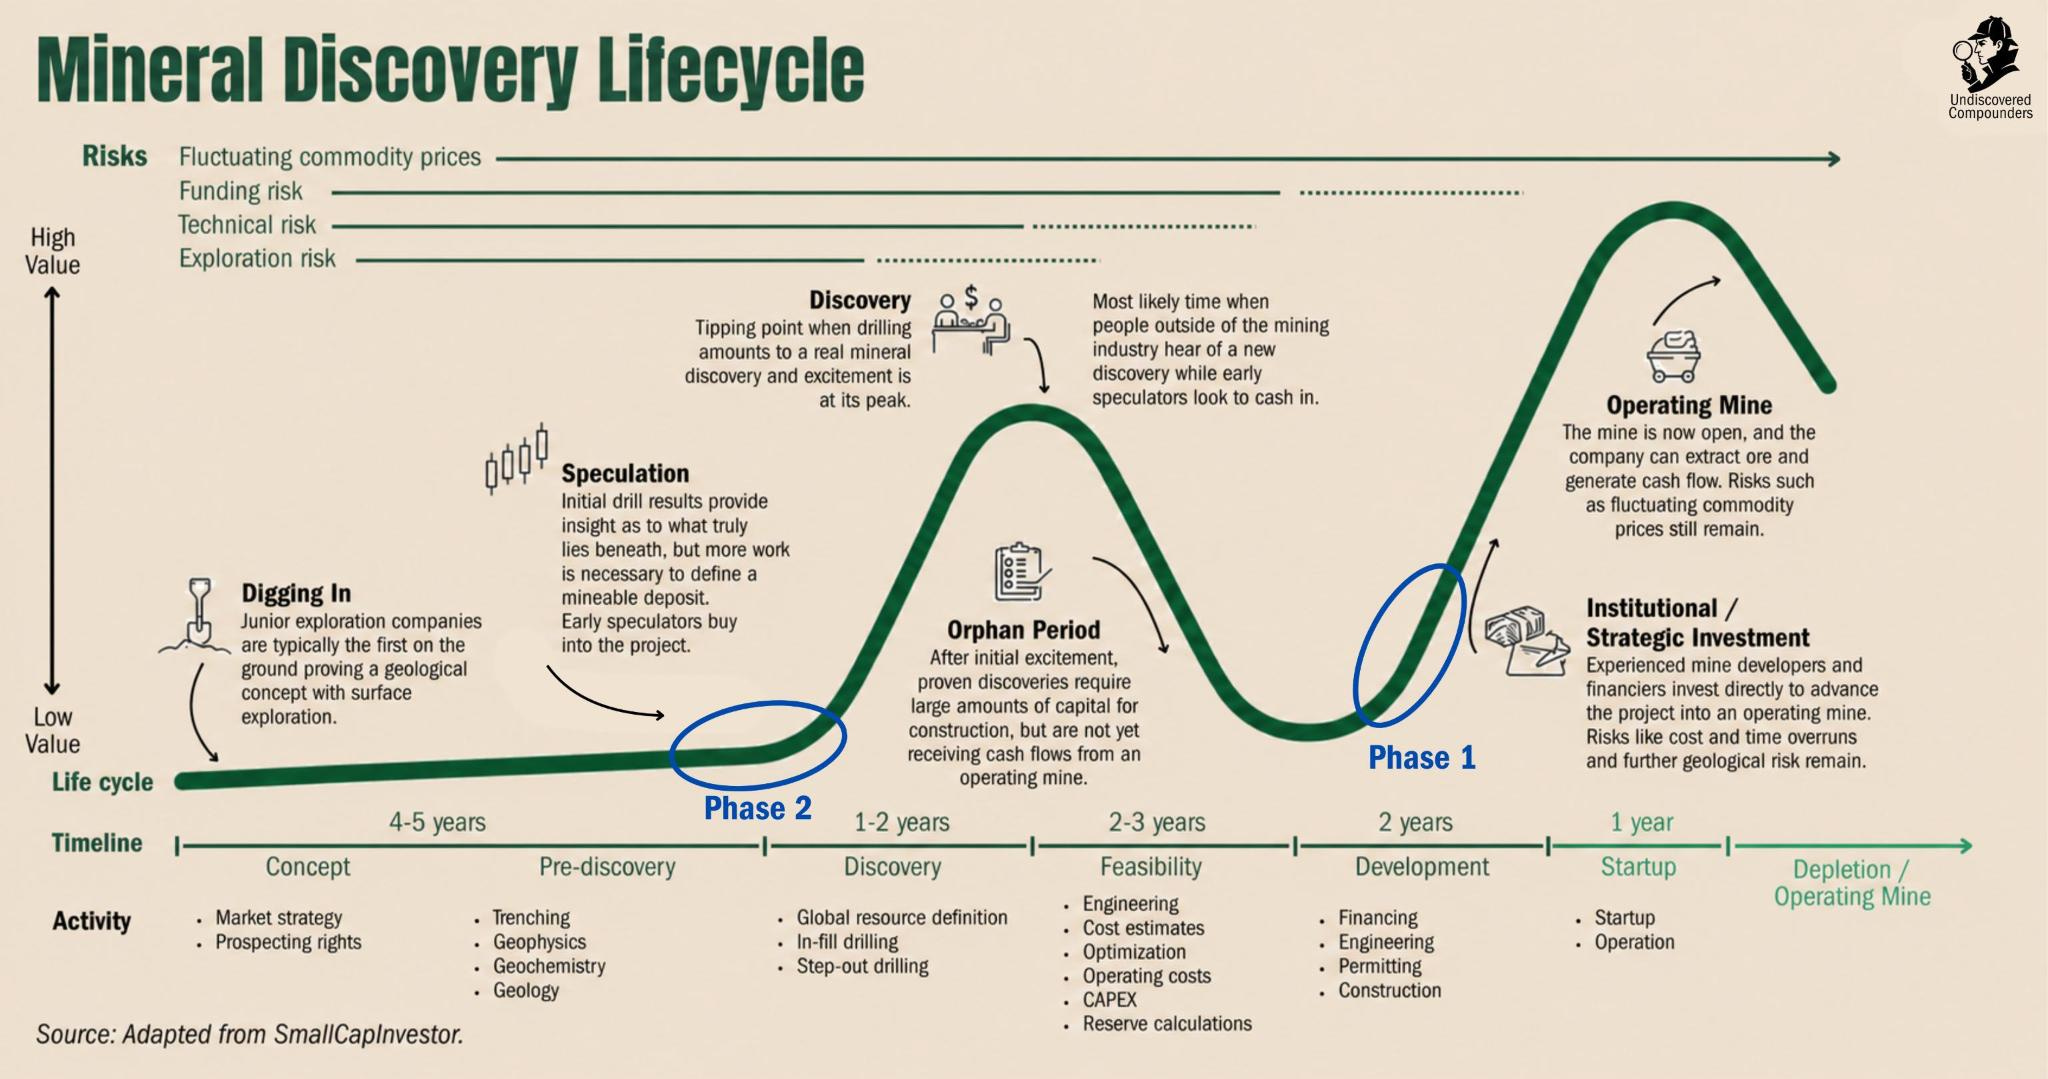
And it doesn’t stop there. Re-rating opportunities? Cabral has plenty. But one thing at a time.
Before we even analyze the company itself, let’s take a quick detour through the gold miners. Four pretty charts summed up in five sentences:
Gold miners are historically cheap relative to gold.
Gold miners are historically cheap relative to the S&P 500.
Gold miner valuations haven’t kept up with their cash flow growth.
Gold miner margins are historically high.
All of it despite, or thanks to, one of the worst quarters in the history of gold.
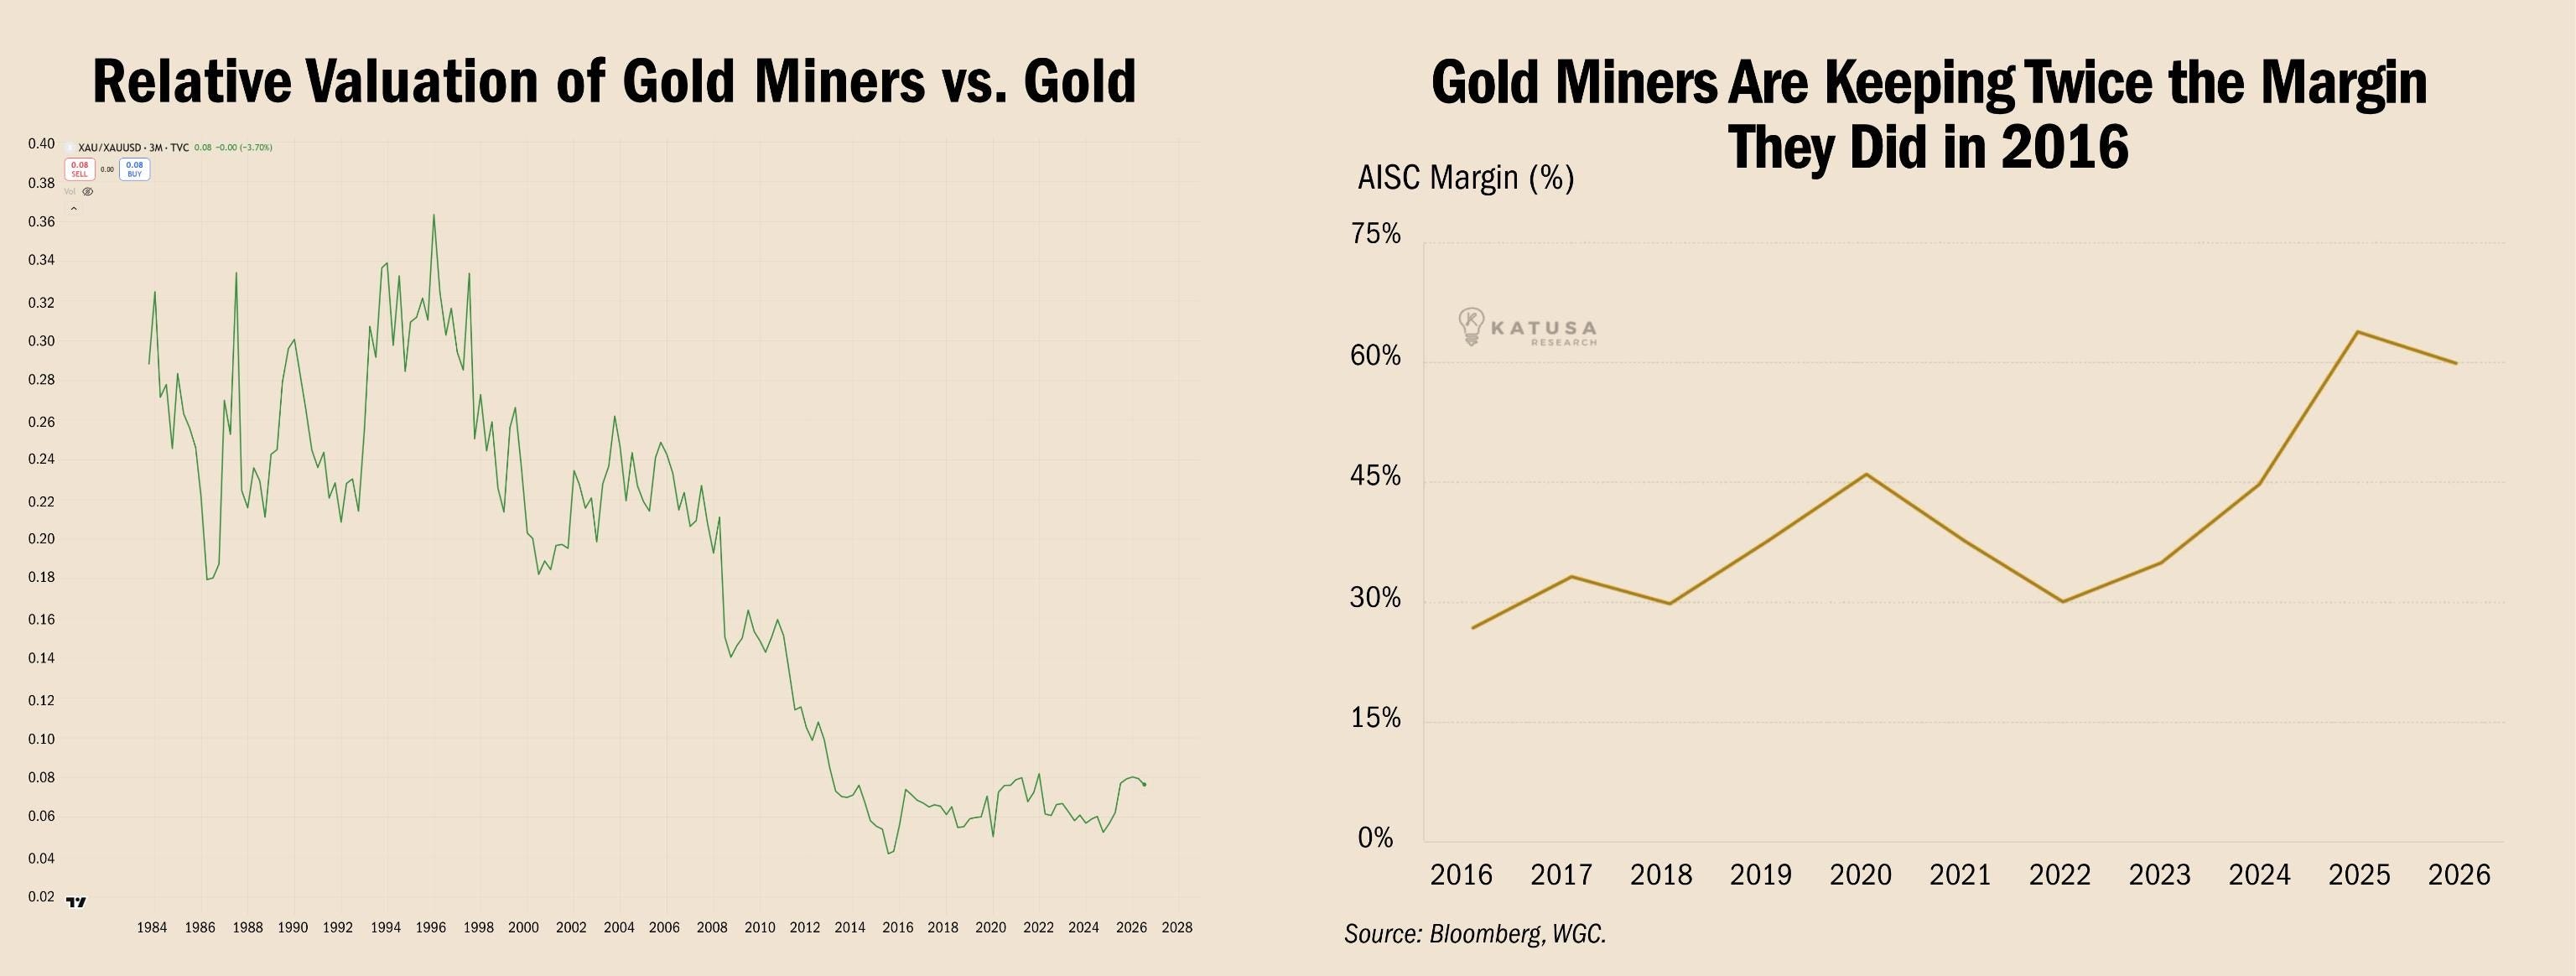
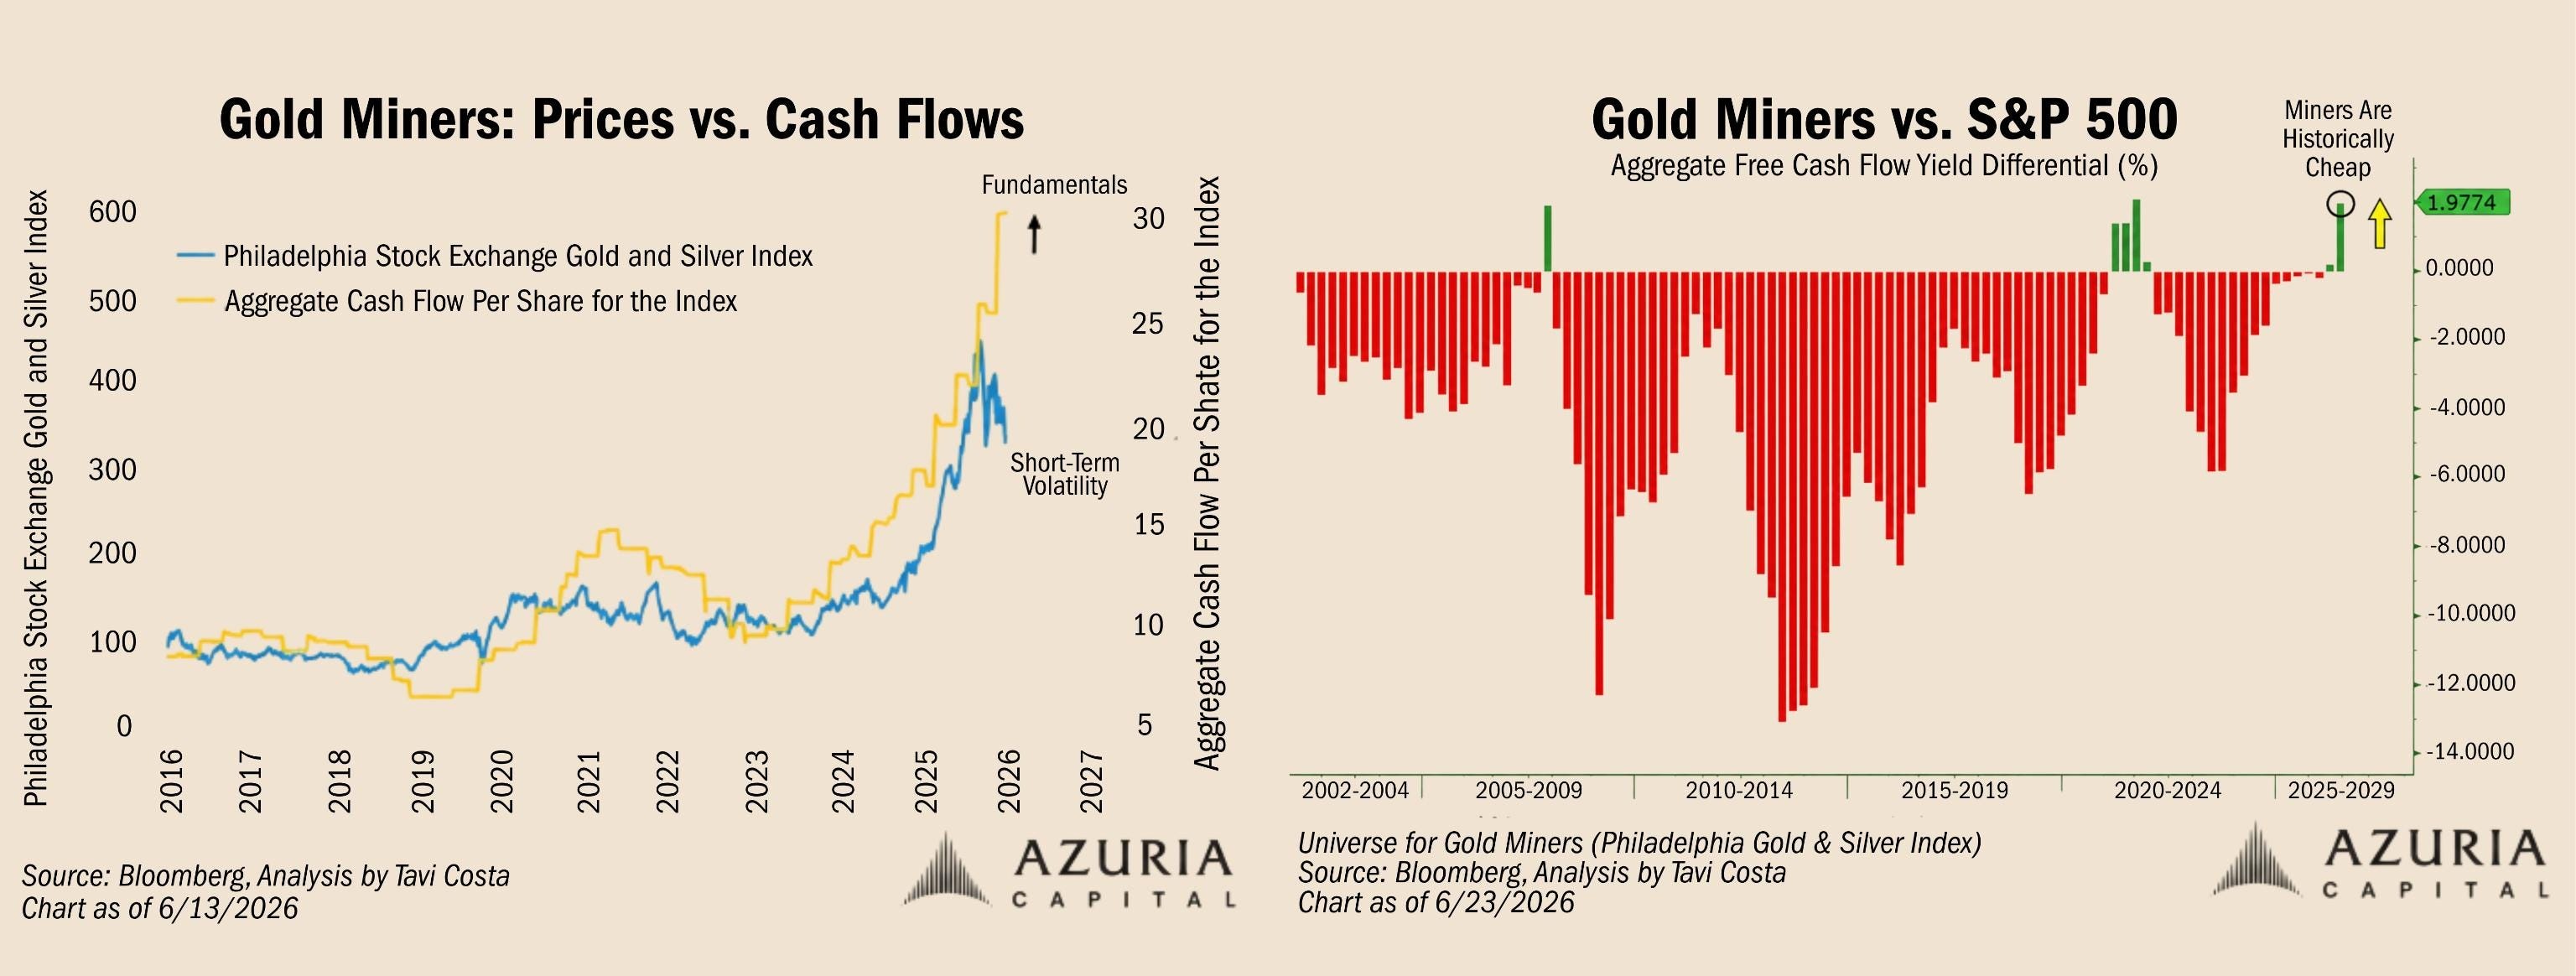
That’s it, I’m done with the sector. No macro. It’s outside my circle of competence. At most, it should be free optionality. The only acceptable way to profit from it is finding a gold miner that justifies a thesis all on its own, without having to assume a higher gold price or a sector re-rating. Cabral Gold is cut from that cloth.
Like Atlas Salt, the setup is drowned in complexity and geological subtleties, the kind that takes an enormous amount of work to properly get your head around. I did that work, then reworked the whole thing so the uninitiated can follow it end to end.
The full write-up is 35k words. For those in a hurry, a 10-minute version of the most important bits lives here.
Before we start, a thank-you to GrumpierByTheDay, who put the company on my radar. Don’t let the name fool you: the guy is genuinely one of a kind, and generous enough to share his portfolio and his sharp analyses for free on X. Follow him. You won’t regret it. I don’t.
Let’s go.
0. The Cabral Gold situation, in brief
Company: Cabral Gold.
Ticker: CBR.TSXV; CBGZF.OTC.
Share price: C$1.00.
Market cap: about C$305M, 305.4M shares out.
The setup comes down to four points:
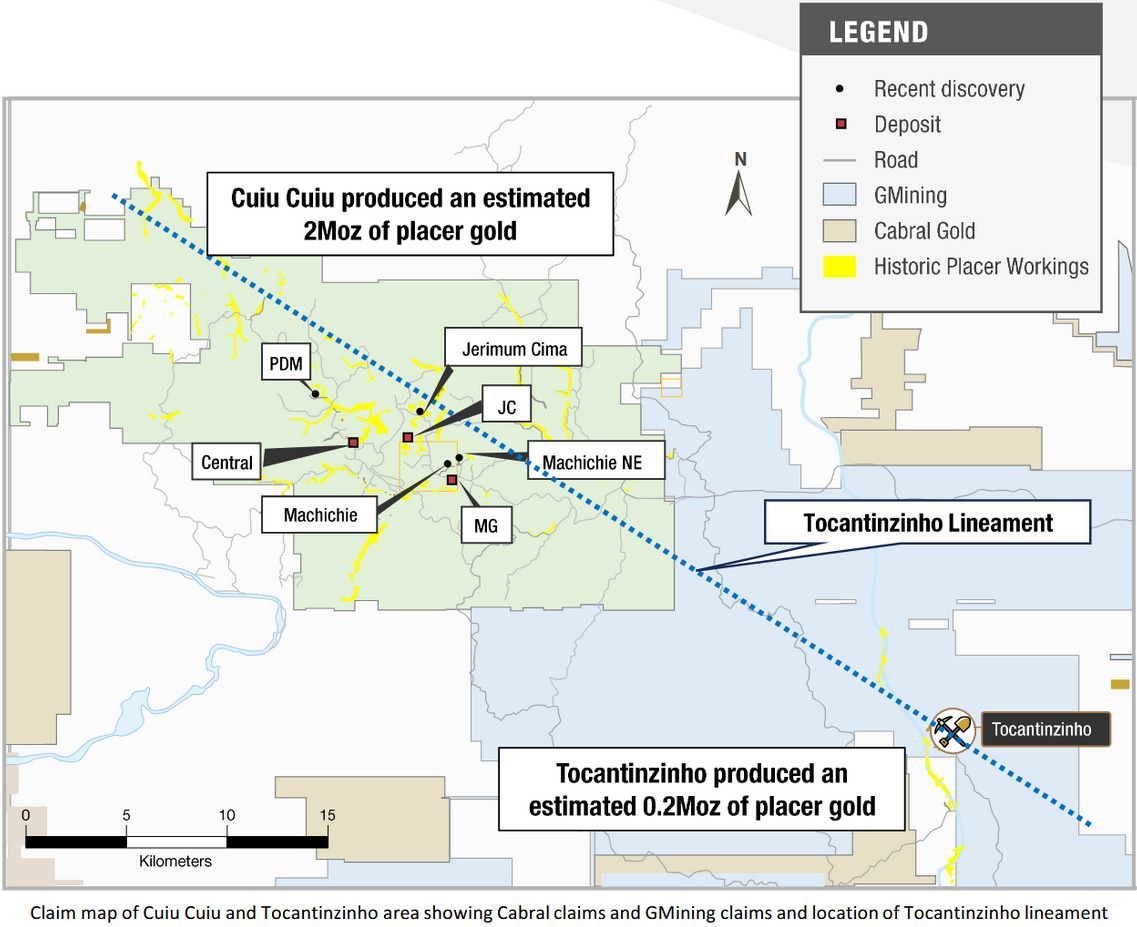
Cabral owns 100% of Cuiú Cuiú: 306 km² in a single contiguous block over the biggest historical gold-panning camp in the Tapajós (Pará, Brazil). About 2 Moz of gold came out of the camp’s rivers, and to this day nobody knows where those 2 Moz came from. Wild guess: somewhere deep under Cuiú Cuiú? Bonus: 25 km away sits Tocantinzinho, Brazil’s third-biggest gold mine, built on budget. Second bonus: Cabral’s CEO co-discovered Tocantinzinho.
Cabral’s first production, expected Q4-26: a small mine sitting in the soft surface layer (the “oxide”), 128,903 ounces of reserve, US$37.7M of CapEx already funded by a gold loan, construction about 85% done. Design AISC (all-in sustaining cost): about US$1,210 an ounce versus gold at about US$4,000.
This mine already has a reason to exist: generate the cash that will drill the rest of the district (and find the source of those 2 Moz recovered from the rivers) without a dilutive trip back to the market. 75-80% of the ounces discovered so far sleep in hard rock below the surface, frozen in a 2022 estimate run at $1,800 gold, plus some fifty targets never drilled. Resource update late 2026, first hard-rock study Q2-27.
The market is pricing the small mine: at today’s gold price, the discounted value of the reserve alone covers most of the market cap. The whole district goes for tens of millions.
The bet plays out on three points.
Execution. First build for a CEO who’s spent his life making discoveries. Against that: a job site on time and on budget with more than 90% of costs locked in, and a construction manager who’s already built two Brazilian heap leaches, including the country’s biggest at the time.
Permitted throughput. The plant is sized for 1 Mt/yr at full tilt. Current permits cap production at a third of that (soon half, most likely). The catch: the gold loan repays in a fixed number of physical ounces starting March 2027. At full throughput, everything else in the story gets paid out of the gold that isn’t going to the lender. If permits throttle production too hard, the self-funding breaks down completely. Production isn’t at full rate yet, so today’s permits don’t bind yet, but a few desks inside one Pará agency can kill this thesis.
The denominators. Three quarters of the official resource dates from a world of $1,800 gold, from before 35,000 m of drilling and four named discoveries. The late-2026 update re-counts everything: four years of drilling already paid for and published hole by hole, and not a single ounce of it counted yet. A big variable with big re-rate potential. Or not.
Why now? The window between first pour and the resource update is where the information is richest and the re-rating barely under way. It’s a way to play the two best moments on the Lassonde curve at once: before production and before a discovery. As for timing, four announcements were running late. The first (first ore) landed July 9, while I was writing these lines. Three are still pending: two start-up permits plus one resource upgrade to Measured. It’s a matter of weeks.
What can break, in one line: the throughput permit combined with repayment in ounces (the only thesis breaker), start-up metallurgy (margin erosion, softened or offset by the gold price), and two upcoming studies that could make my scenarios obsolete. The full list, with the signals to watch and the consequences, is in Part 13.
To sum up: metallurgy, construction, drilling and discoveries. Forget market orders after a big-number drill result hits the wire. The edge here comes from understanding the setup and its (many) subtleties in detail.
Adding gold miner exposure is a priority for my portfolio, and this company has become my lead candidate. I’m not a shareholder at the moment, but I have cash parked and waiting on a few things before I buy. The criteria and the reasoning are spelled out below, of course.
(A word of advice: get yourself a hot drink and a source of glucose; your neurons are going to need both.)
1. Cabral Gold and its two-phase strategy
Cabral Gold is a pre-revenue gold developer. Its latest bottom line is a C$8.2M loss for the quarter ended March 31, 2026 (expensed drilling + stock comp + revaluation entries).
If the schedule holds, the company pours its first doré (the raw gold-silver bar) in Q4-26 at Cuiú Cuiú, smack in the middle of the Amazon. The mine producing it is the most rudimentary, cheapest thing the industry builds: an oxide leach mine. Think of it as making coffee with a filter:
Oxide -> the top of the deposit (the first few tens of meters) rotted in place for millions of years under a tropical climate, turning into a clay (saprolite, to its friends) you can literally mine with a shovel.
Leaching -> you pile it all on an impermeable liner (the filter), irrigate it with a cyanide solution that dissolves the gold as it percolates down, then collect the gold-loaded solution at the bottom (the hot coffee, ready to drink). Finally, that coffee runs through activated carbon: a sponge for dissolved gold that you just wring out before pouring bars.
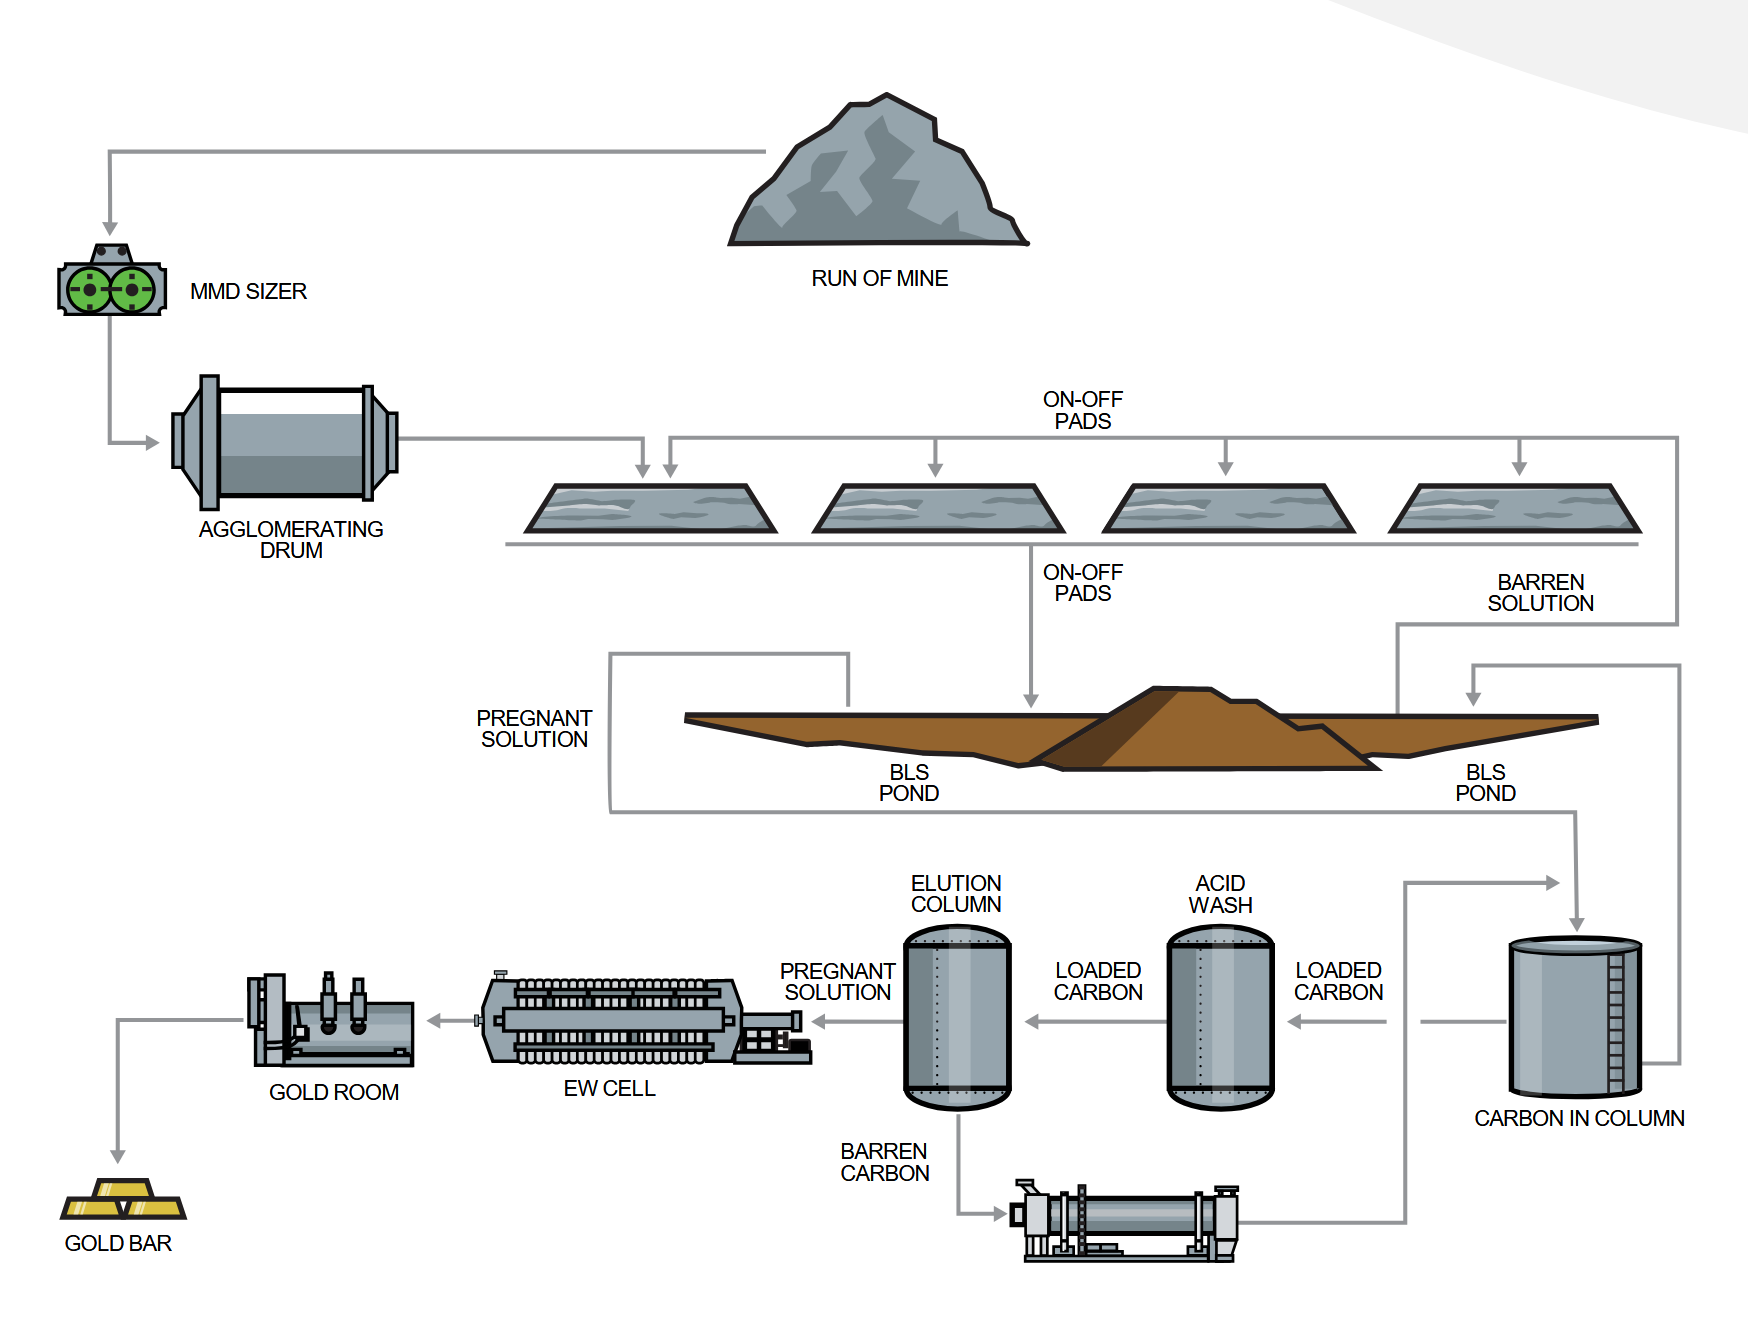
The mine plan calls for 128,903 ounces of Probable reserve at 0.65 g/t, with an AISC (all-in sustaining cost, the full cost of producing an ounce) of US$1,210/oz. With spot gold around US$4,000, every ounce coming off the heap leaves about US$2,800 of margin. On start-up production of 20-25 koz annualized, the CEO is talking cash flow on the order of US$70M a year at run rate. Even after a severe haircut (always doubt management’s estimates), the little plant quickly spits out more cash than the company has ever raised in a year.
Discount that stream over the 6.2-year mine life, note that even at a 5% rate you land too close to the market cap, and on to the next name. Anyone who reasoned that way just missed one of the rarest setups in mining. What we’ve just described is only Phase 1 of a bigger plan: build a district. The 6.2-year mine plan is just a way to fund Phase 2: intensive exploration and potential production at a much bigger scale.
The real thesis lives under that big pile of saprolite: about 75-80% of the ounces already discovered at Cuiú Cuiú sleep in the fresh, dense rock that has been resting under the clay for millions of years. Potentially far more, if the 2 Moz recovered from the rivers really did come from the deep rocks of Cuiú Cuiú.
To sum up: Phase 1 mines the skin of the deposit, and the cash it throws off pays to X-ray the skeleton (PEA targeted Q2-27).
1.1 The mechanism in detail
This “self-funding model” is nothing new. It’s even a staple of junior presentations, very (too) often undeservedly. Let’s check its viability for Cabral.
On the sources side: about C$50M of cash in early April 2026 after the C$20M bought deal, plus the margin on Phase 1 gold once production starts.
On the uses side:
the remaining mine CapEx (about 15% left of US$37.7M, over 90% committed)
US$5-8M a year of drilling for six rigs and 25-30,000 m every six months
sustaining capital (US$8M of sustaining over the life of mine)
the gold-loan repayment: 39 kg of gold per quarter (about 5,000 oz/yr), starting March 31, 2027.
At full throughput (1 Mtpa), the mechanics close the loop with room to spare: loan repayment absorbs about 27% of 2027-2028 payable ounces (31% with interest), drilling is comfortably covered by what’s left, and cash piles up fast. Great. Capped at 500 kt/yr, the machine jams: the 39 kg due each quarter, plus interest, eat two thirds of the ounces produced. Exploration stops being automatically free and would probably require dilution or more loans.
On paper it works. Now for the part that isn’t on paper.
1.2 The four arguments for the sequencing
First off, why this plan? Why not think big, drill the district for five years and build afterwards?
For four good reasons.
One: the initial CapEx is tiny. US$37.7M, funded by a gold loan and one raise, with no massive dilution. That’s about as close to ideal as developer financing gets. The flip side: it makes the whole thing look like a small six-year mine and hides the district. For a potential shareholder who does his homework, that’s a plus.
Two: mining the oxide is pre-stripping the hard rock. The district’s war chest sits at depth. Stripping the top and treating it as waste is CapEx thrown away. By mining the gold in the surface layers, you cut the cost of going after the future gold in the buried hard rock, by cutting the strip ratio (the tonnes of waste moved per tonne of ore). It’s a win-win.
Three: the operating platform. Cast the net wide: camp, road, grid, laboratory, Brazilian team, a production and compliance track record, etc., everything that makes Phase 2 cheaper to finance and faster to permit.
Four, and not the least of them: the cash self-funds exploration without dilution, provided the permits keep pace. If they don’t, it still shrinks the dilution needed, and the earlier points still hold.
1.3 The legal structure
Cabral Gold Inc. is incorporated in British Columbia and owns 100% of Magellan Minerais Prospecção Geológica Ltda (Magellan Minerals), the Brazilian subsidiary that carries the 30k ha of Cuiú Cuiú (an intermediate holding company, Cabral Gold B.C., sits between the two). But the lineage is older than Cabral Gold. Magellan Minerals acquired the ground in 2005, discovered Central and MG (two of the district’s discoveries), hibernated from 2012 to 2016, then got rehoused into Cabral through the RTO of a shell (San Angelo Oil) in 2017. Alan Carter (the CEO) has been at the wheel of Magellan since at least 2012, and at Cabral’s since day one.
One subtlety: the gold loan holds a first lien over those subsidiaries. Put differently, the creditor, who is also the biggest shareholder, sits on the entire district, not just the plant.
1.4 Why the mining asset is rare
Every mining story claims a rare asset. Here, I can describe the rarity factually:
the biggest historical placer camp in the Tapajós (placer: gold naturally eroded out of deep rock and redeposited in river gravel), at about 2 Moz alluvial;
consolidated into a single block of about 306 km² under a single operator (the actual ownership is more complex, we’ll come back to it);
about 25 km from one of Brazil’s biggest producing gold mines (Tocantinzinho, we’ll come back to that too);
holding the camp’s only 43-101 resource (the Canadian standard for mining estimates) and,
since March 2026, the first mining Licença Prévia (the hardest regulatory wall in Brazilian permitting) ever granted on this camp in the deposit’s forty-year history.
On the balance sheet, the district simply doesn’t show up: the C$74.3M of assets is mostly financing cash (C$31.9M), a build being capitalized, and exploration expensed away over the years. Half a century of garimpeiro rush (Brazil’s artisanal gold mining) and what that rush implies about the gold still in the ground: zero accounting dollars. In defense of the accounting rules, how would you even book that? It’s the market’s job, and whether the market has done that job is the whole subject of the sections ahead.
First, the ground. A district thesis is judged on the district.
2. The Tapajós and those 2 million unexplained alluvial ounces
2.1 A province, in the strong sense
To say that “gold province” is an overused term is an understatement. Allow me, then, to justify it.
The story begins with a collision: two continental plates smashing into each other for tens of millions of years. The crust folds until it breaks, letting fluids charged with gold, up from the depths, spread along the fractures. This work site is called an orogeny. When it has worked hard enough for long enough, it leaves a whole province behind it: a region where the structures are measured at the scale of the earth’s crust, with fractures that follow each other over hundreds of kilometers, with, among them, dozens of deposits that share the same origin and the same plumbing. Consequence: the discoveries gather there, and the method that found the first deposit often finds the seventh.
It’s a very closed club: the Tintina in the Yukon, the Abitibi in Québec or the West African Birimian. The Brazilian Tapajós belongs to this category, and it is very probably its least-drilled member.
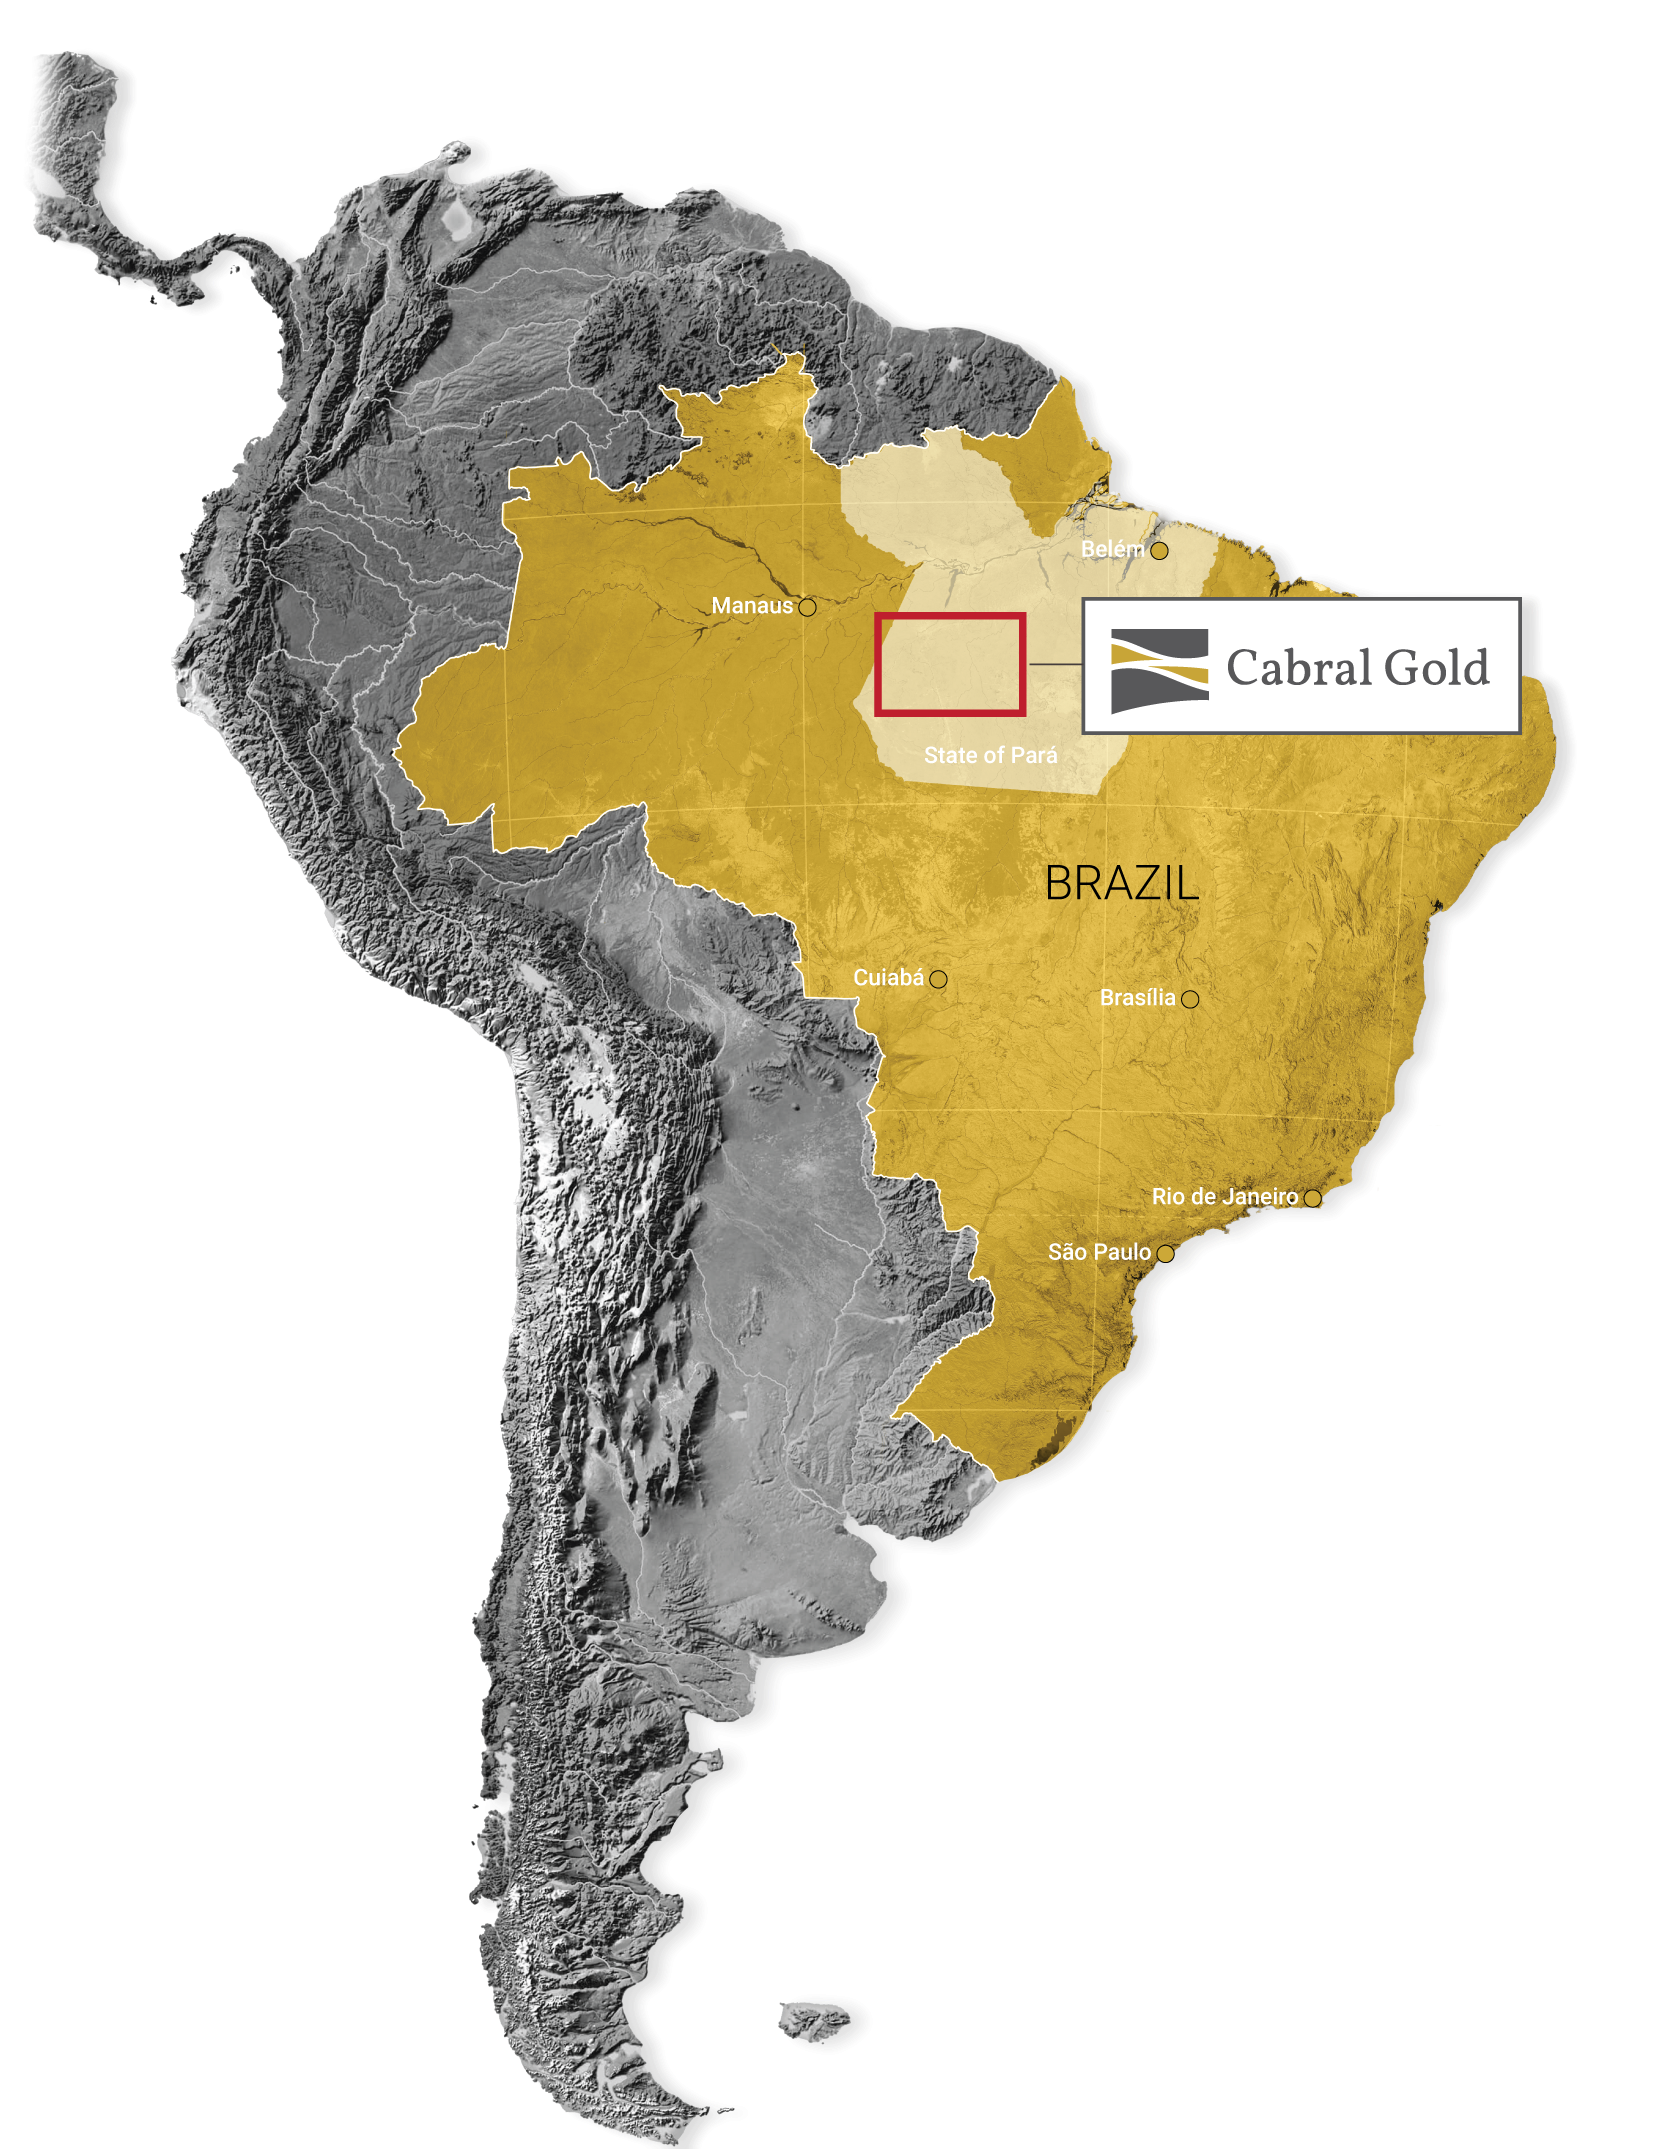
To understand why, we need a little geography. South America has a core: a basement that runs from Bolivia to Venezuela and that hasn’t moved for about two billion years. This is what we call a craton (Amazonian, in this case): the ancient and rigid heart of a continent, which has finished deforming, and which is stable enough to conserve what time had the decency to deposit there. The Tapajós Mineral Province occupies the middle of this core, on the block called Tapajós-Parima. 2B years ago, this crust was the neighbor of West Africa, close to the Birimian mentioned just above. The Tapajós is therefore a direct cousin of the Birimian, the basement that hosts a good part of African gold production.
Why, then, does a cousin of the Birimian remain so little drilled? Three good reasons:
The Tapajós rock is very shy. It does not show itself in public (a geologist would say it doesn’t outcrop). Elsewhere, a prospector walks the ground, breaks an outcrop with the hammer and follows a vein with his eyes. Here, the entire basement has rotted in place into a soft clay (yes, the saprolite again), itself covered by sediments over time and erosion. Consequence, surface mapping “provides limited insight”, and even the trenches show nothing but rot. To summarize: 0 outcrop = classic prospecting useless = geophysics + meters of drilling = spending capital.
Access. Jungle, rivers, all of it in a capricious climate. Nothing surprising in there being no road network suited to facilitate drilling and discoveries.
The permitting regime. We’re talking years, even more than a decade, for a complete cycle: Cabral’s LP (Licença Prévia), the first of the three Brazilian environmental licenses, took about five years of processing.
Add on top of that an exclusively artisanal production (the alluvial gold) and the paradox becomes evident: part of the gold was already accessible enough, and it wasn’t worth the cost of spending all that capital to go looking for the potentially big treasure below.
Today, this potential treasure is barely beginning to be X-rayed, and it holds one of the central roles in this thesis.
2.2 The gold rush, and the exploration logic it imposes
The numbers of the garimpo rush, the gold recovered from the rivers (once again, synonymous with a deposit nearby), have a few specificities that need to be explained.
Officially recorded production: about 159 tonnes, about 5.1 Moz. Those who know how the region functions know that this is necessarily underestimated, a large part of this gold never passed through the official channels. The ANM itself (the federal mining agency) estimates the real number between 30 and 50 Moz. The serious estimates of the real number are closer to 20-30 Moz. At the peak, more than 250,000 garimpeiros were together pulling out more than a million ounces per year. Today about 30,000 of them remain, for about 200 koz/yr. The gap between 5 and 30 Moz will never close, informal gold will never enter the registers. No matter. What counts is that all this gold was gathered in river gravels. Now, the gold of a river always comes from elsewhere. Erosion tore it from hard-rock veins somewhere upstream, then the current sorted it and concentrated it for millions of years. And nobody has yet found the bulk of these veins.
Cuiú Cuiú is the center of gravity of this story: the biggest placer camp of the whole Tapajós (I remind you, about 2 Moz alluvial according to the ANM estimate). To give context, see it as a village of about 5,000 inhabitants put up in the middle of the 1970s, with daily air links well into the 1990s. But it’s another context that interests us here. Let’s calibrate a little. The Tocantinzinho placer, before 2 Moz were discovered there in the buried rock, weighed about 200 koz. So:
200 koz of Tocantinzinho placer led to a 2 Moz mine.
2 Moz of placer for Cuiú Cuiú, and the current estimates of gold in the rock cap out at 1.2 Moz.
Compute the potential ratio versus Tocantinzinho yourself.
116,000 m of drilling and two decades later, the key sentence of the whole case fits in one line from Carter: the bulk of the placer gold of Cuiú Cuiú remains “still unexplained” (March 16, 2026). The known deposits are very far from explaining the origin of those 2 Moz recovered from the rivers.
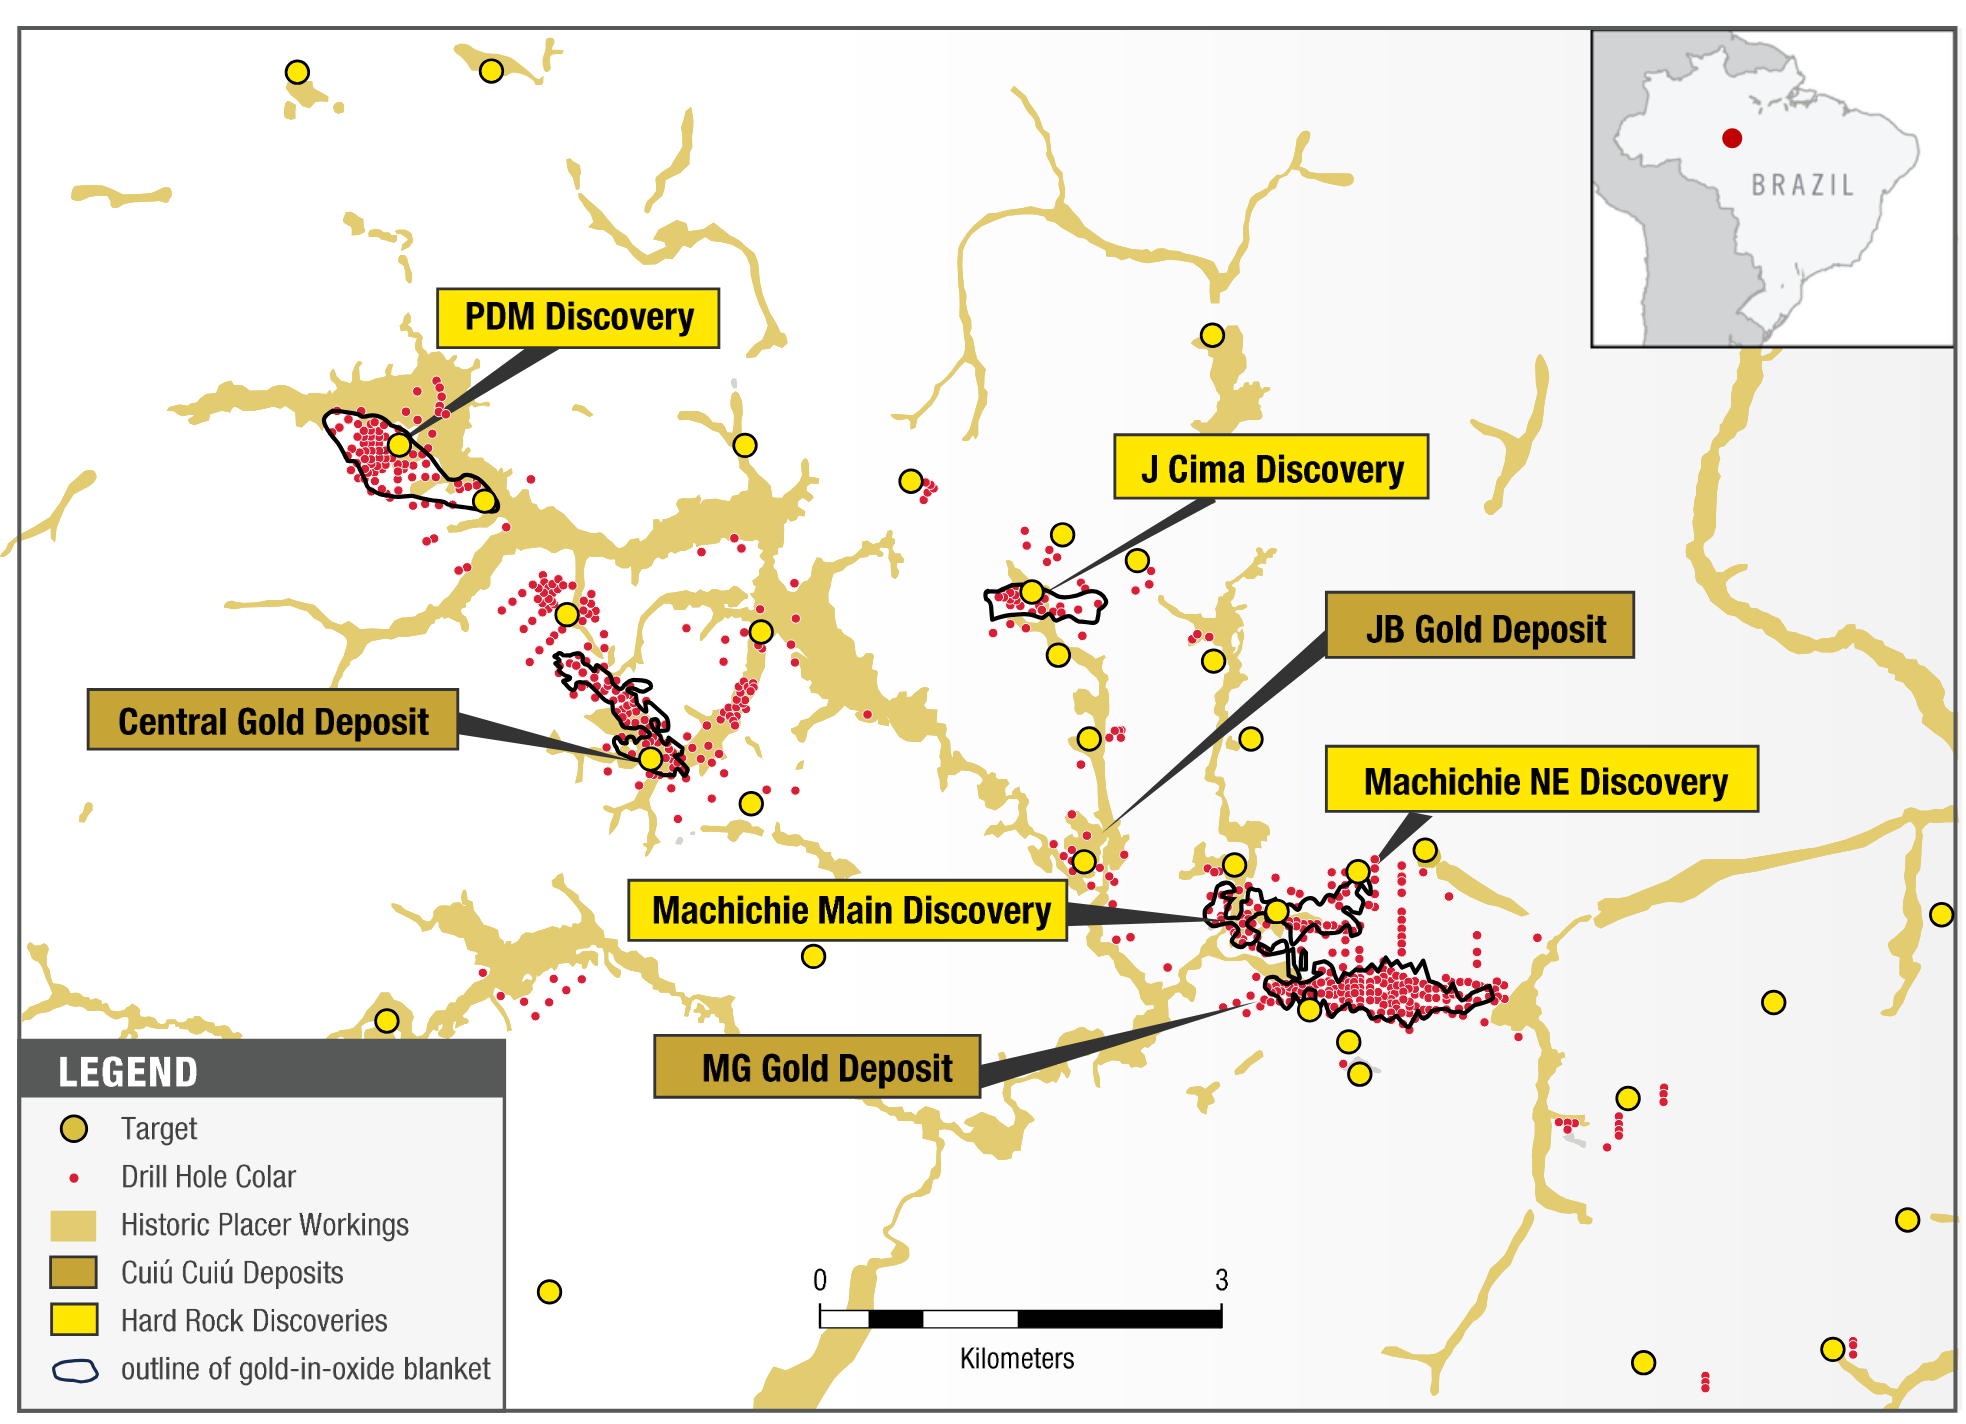
This is proof of nothing. Geology can be very capricious. But the argument is all the same very directional. And it’s not over. The gold-in-soil anomaly is about 7 km long at Cuiú Cuiú, against about 1 km at Tocantinzinho before its discovery. An argument, also, very directional. Count about ten boulder fields at surface (mineralized blocks that erosion detached from a nearby vein never found), some grading 74 to 92 g/t on average (the Alonso field at 91.7). Nothing here is proof of ounces. But they say where to look, and above all, that the hunt is far from over.
2.3 Tocantinzinho, the proof next door
Some fifteen kilometers southeast of the property, on the same structure, the third-biggest gold mine of Brazil (according to G Mining) has been running since September 2024, about 25 km deposit to deposit. See Tocantinzinho (developed by G Mining) as exhibit A of the jurisdiction case. It will be a comp all along this write-up, so it’s worth the trouble of detailing it here.
A few facts on the mine to start:
P+P reserves (Proven plus Probable, the inventory committed to a mine plan): about 48.7 Mt grading 1.31 g/t, about 2.04 Moz.
CapEx of the feasibility study: US$458M, delivered within budget (uncommon enough to be mentioned) with US$447M spent + US$11M committed at 93% completion.
First pour July 2024, with first commercial production September 2024, also on time.
First full year: 171,871 oz (2025) at an AISC of US$1,155/oz.
On the financing side it stings a little, however. G Mining signed a stream with Franco-Nevada: US$250M received upfront, in exchange for the right for Franco-Nevada to buy 12.5% of production while paying only 20% of the market price, up to 300 koz delivered, then 7.5% after. Just reading it stings. We’ll talk about it again.
The market rewarded this whole journey: about C$196M of market cap at the end of 2021 vs about C$9.24B today. Of course, the raw number mixes re-rating + dilution. To be more precise: x3.9 in the single year of the developer-to-producer transition, and about x8.8 per share in 26 months.
Tocantinzinho cleared the path the forest for Cuiú Cuiú.
It proved everything an investor can demand of a jurisdiction, step by step. A Pará deposit, on this structure, can obtain its three environmental licenses (the LP of the concept in 2012, the LI to build in 2017, the LO to operate in 2024; twelve years at the counter...). It can then finance itself, get built without exploding the budget, then produce what the management had promised. And at the end, the market pays. In short, the story can materialize.
It also improves the quality of the case itself. A jurisdiction that has already said yes has even more chance of saying yes, a build precedent to reproduce, infrastructure already financed (the road that serves Tocantinzinho passes through the region) and a capital market that has already touched the Tapajós. In short, the story has more chance of materializing.
What Tocantinzinho does not prove: that Cuiú Cuiú contains 2 mineable Moz. Or even that it holds far more than Tocantinzinho itself. Geology is not necessarily transitive.
The “irony” of the story: it’s Cabral’s CEO and his team (who in part followed him to Cabral) who participated in the discovery of Tocantinzinho some twenty years ago. If someone can transform all of this into a district, it’s him. As for building it, that’s more complicated. We’ll come back to it.
2.4 The ground: a single owner of 306 km²
The package comes to 30,563 ha, about 306 km². Among them, eighteen mining titles.
To read the title portfolio, one line of Brazilian administration suffices: an exploration permit gives the right to drill, but never to mine. Mining demands a mining concession, whose processing takes years. Between exploration and mining there exists a jump seat: the GU (Guia de Utilização), a trial-mining permit (capped, of course) attached to a concession application under processing. The objective is to give miners a permit that allows production while waiting for the final production permit to arrive (see it as a lubricant of a system a little too complex).
Cabral’s eighteen titles also line up on this scale: fifteen exploration permits in the pocket plus a sixteenth in application (enough to drill the district), and two concession applications under processing, each carrying a GU. It’s these two GUs that keep Phase 1 running: the Q4 2026 mine starts on the jump seats, while the real seats get processed, slowly.
The ownership. Everything is 100% Cabral’s, via Magellan Minerais, the Brazilian subsidiary. Of the 30,563 ha, 11,980 are in Magellan’s name, the direct title. The remaining 18,583 are said to be “in indirect interest”. It’s a rather unusual arrangement, which reflects in large part the social risk. These 18,583 ha are registered in the name of the cooperative of the local garimpeiros. The arrangement is deliberate. The PLG (the small-mine permit) is a regime reserved for artisanal miners that an industrial company cannot hold. By transferring eleven of its eighteen titles to the cooperative, Cabral gave the garimpeiros a legal framework to work on the property, and reserved for itself by contract the only two things that count: the right to explore this ground, and a buyback option on the titles for the day of the switch to the industrial mine. The framework agreement dates from 2006, renewed in 2017. To summarize: one layer of legal complexity (ownership structure) to face another layer of legal complexity (the permits).
You also have to put this back in the Brazilian cultural context. It’s not rare to see headlines pitting the small artisanal miners against the big mining explorers/producers. Here, the artisanal miners are directly in the title structure, and above all with the incentives needed to want this project to succeed. That doesn’t protect from a conflict, all the more since the final compensation of these PLGs is quantified nowhere. But 20 years of documented coexistence on the biggest garimpeiro camp of the Tapajós is an asset that very few Amazonian juniors can show (and the federal hardening against illegal garimpo makes it even more precious, but we’ll come back to that later).
2.5 The Tocantinzinho Trend Deformation Zone (TTDZ)
Now connect the dots on the map. The crust broke here along a NW-SE corridor of several hundred kilometers, the “Tocantinzinho Trend Deformation Zone” (TTDZ), which G Mining calls the “Chico Torres Megashear” (renaming doesn’t always mean making things simpler).
Remember, the ground does not show its rock. It’s therefore geophysics that must serve as the map. Fly over the jungle with a magnetometer (the aeromag) and the corridor appears as a linear band of weakened magnetic field, a “low” in the jargon (why low for gold, we’ll see later). This corridor threads Cuiú Cuiú, Tocantinzinho, Mamoal, Mato Velho like beads, then Serabi’s underground mines (Palito and Coringa) and São Jorge. It crosses Cabral’s property on the diagonal.
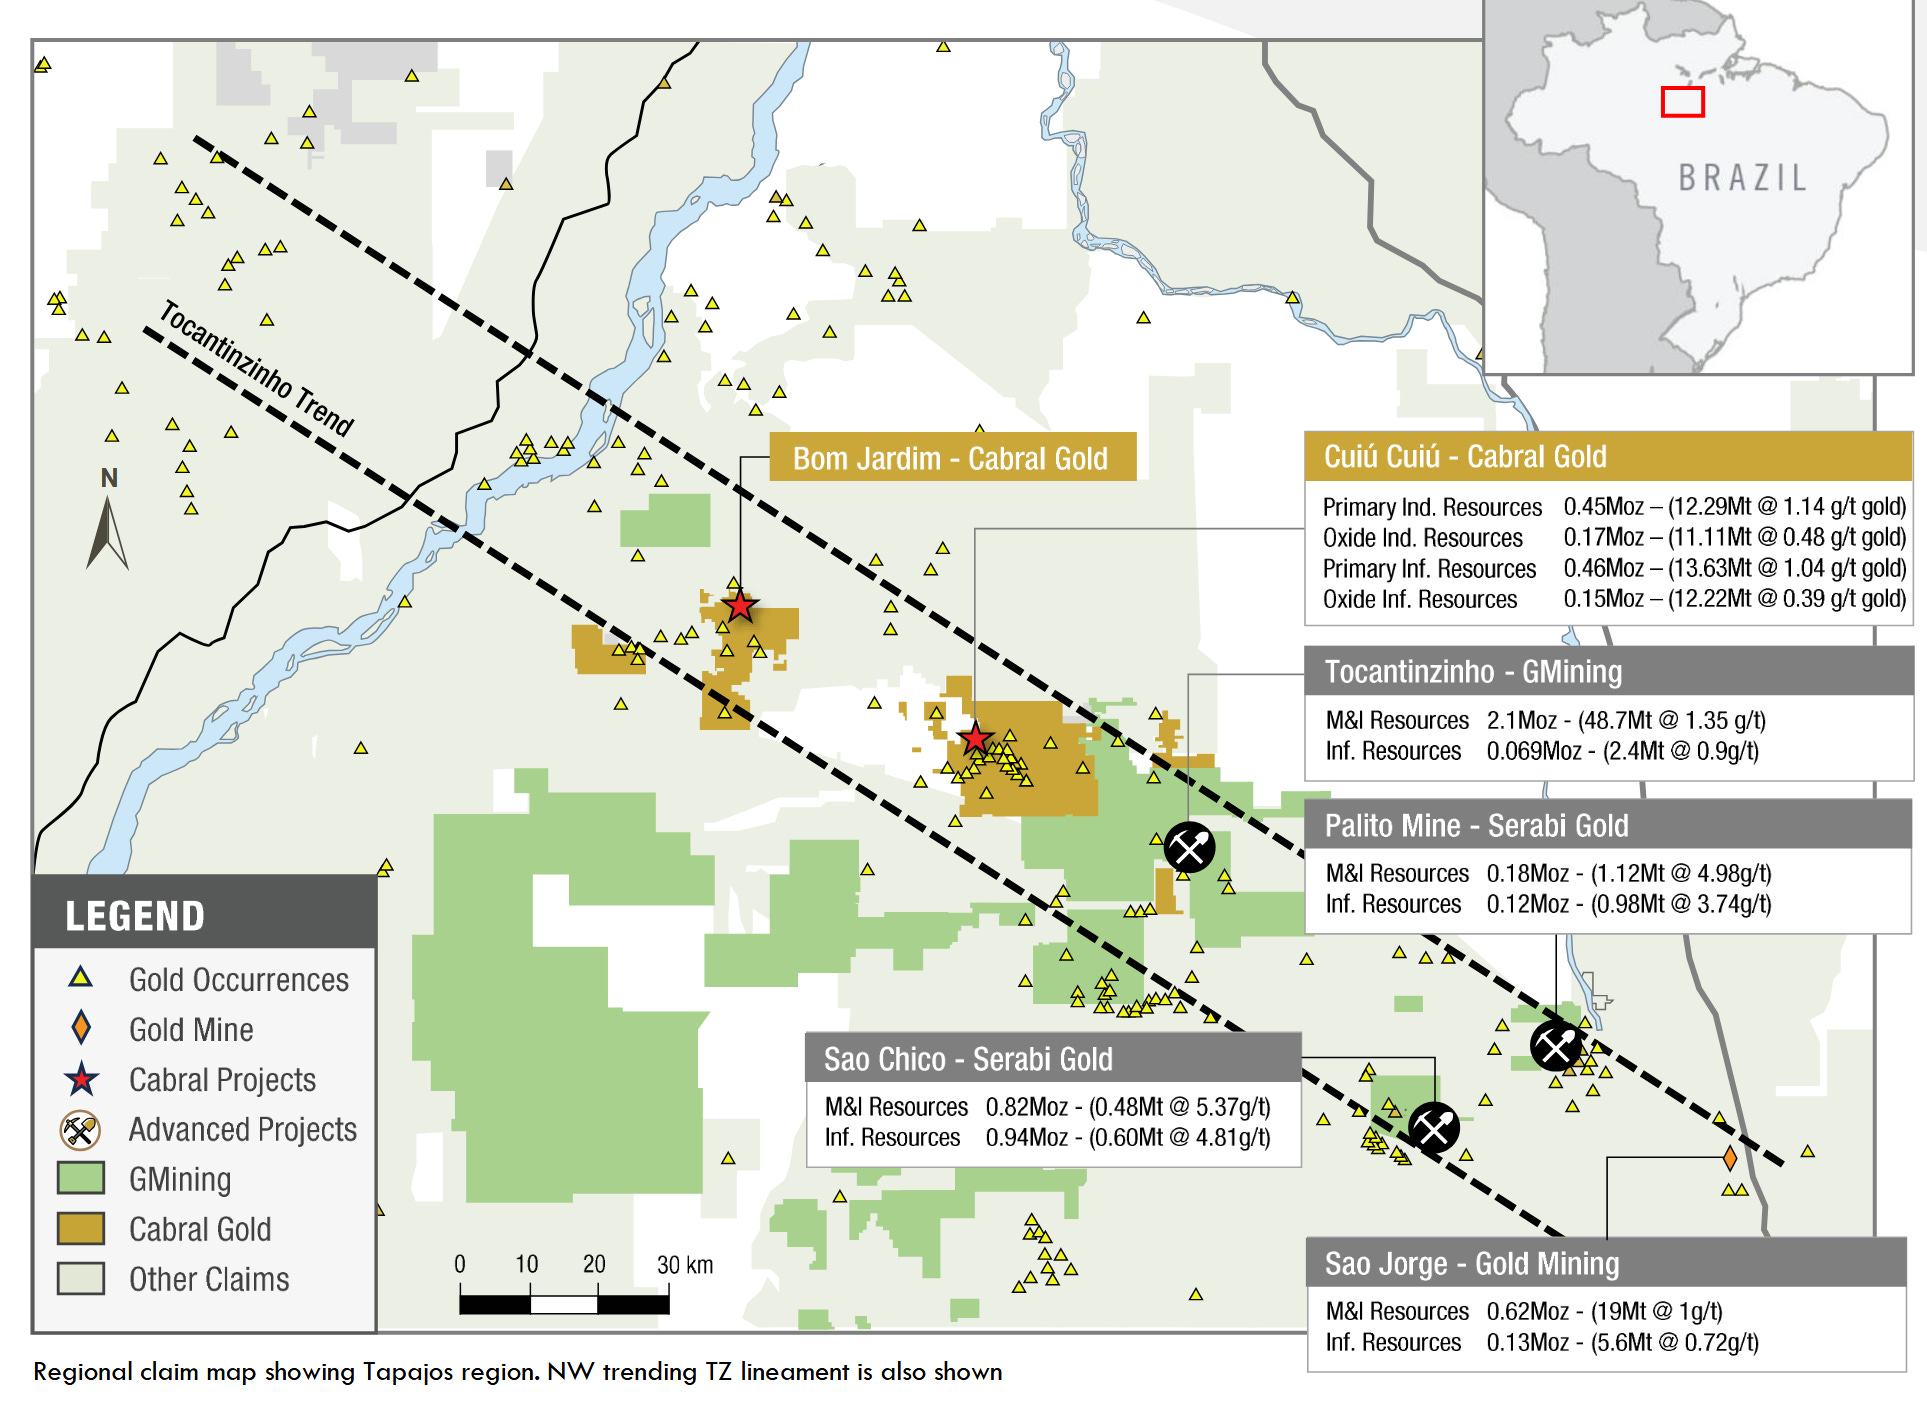
It remains a large-scale structure and it says nothing at all about where to drill, and, too bad if I repeat myself, but a structure does not make a viable mine. On the other hand, a structure that already carries one of the biggest gold mines of Brazil, with two underground mines and a half-dozen advanced deposits, and that crosses the biggest unexplained placer camp of the province, now that gives a lot of theoretical value to Cabral.
But it remains a large-scale analysis. A mine implies discoveries, which implies drilling, which implies knowing where to drill. But once again, the rock does not outcrop. And unfortunately geology does not come to save us on this and it remains the biggest problem... no, I’m kidding. Geology gives us tools that allow us to “see” where the gold is and how it organizes itself.
Be attentive, because it’s here that the potential Cuiú Cuiú value not perceived by the market takes shape.
3. The geology: a body with two states
This section is the longest of the report after the valuation, and rightly so. Everything that follows, the metallurgy, the exploration, the model, rests on a mental image that the market, in my opinion, does not have.
See this section as an investment. Take the time to understand it well and the rest of the report will read twice as fast afterward.
3.1 How the gold arrived there, and the value of the answer to the “how”
Two families of models compete to explain the Tapajós deposits. I promise, the nuance is less academic than it looks.
3.1.1 The pump and the egg
I hope this image is worth a thousand words, but it will not eliminate them.
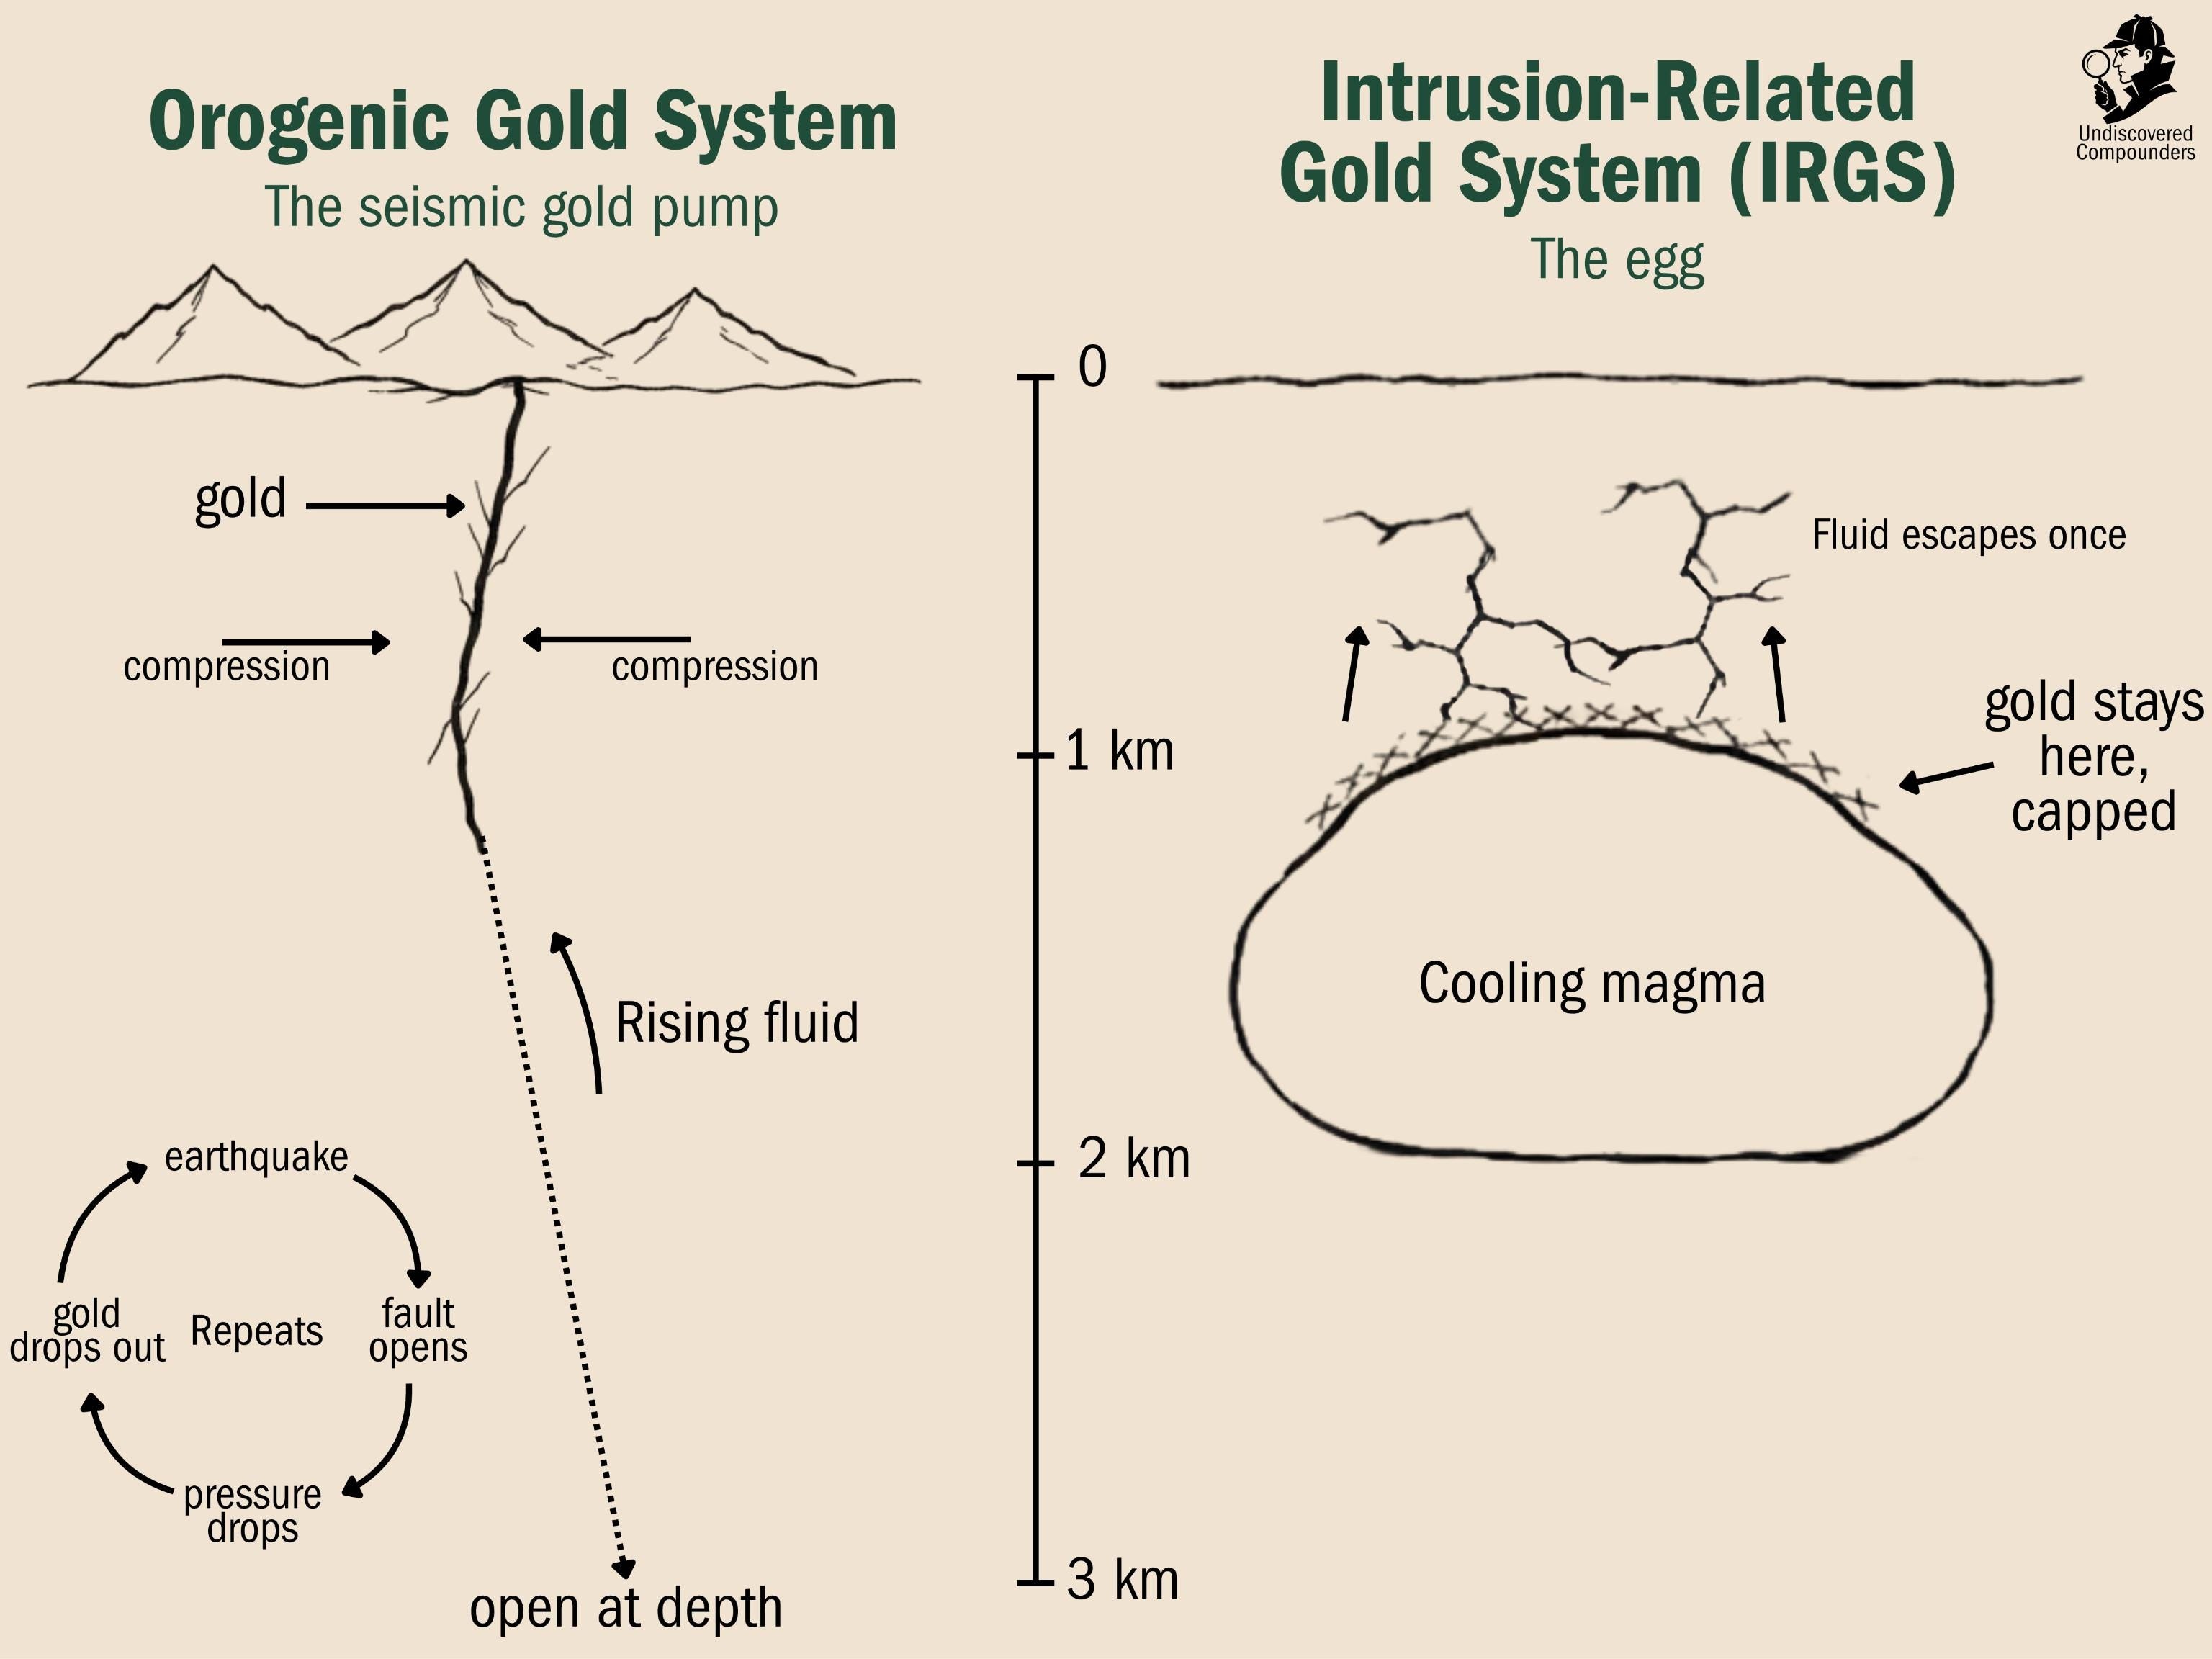
The orogenic model. See it as a metal pump activated by earthquakes (Part 2). During the collision, the rocks compressed at depth release their water charged with dissolved gold. At each big earthquake, the large faults open at once. Voids open up, the pressure drops abruptly and whatever can rush in does, here gold-laden liquid (among other things). Then, the structure stabilizes, the fault closes again, the pressure climbs back, and the cycle starts again. Result: vertical mineralized bodies that can exceed a kilometer of depth. Summary: orogenic = vertical seismic gold pump. Once found, you mostly just follow it down.
The intrusion-related model (IRGS). Here it will take a little more imagination. Imagine an enormous bubble of magma that rises in the crust. After a while, it stops, and cools in place for a million years. This big bubble of cooling magma is called a pluton. The cooling is obviously not uniform, it goes from the edge toward the heart. Now, the crystals that form first during the cooling are very capricious, they accept neither water nor metals in their structure. Everything that does not crystallize therefore concentrates in the remaining liquid, like a sauce reducing. The more the external layers cool, the more this metal-filled liquid concentrates in the internal layers, and the more the pressure rises. After a while, the pressure is such that the metallic juice is expelled into the fissures of the pluton’s roof (think of an egg in its shell that has cooked too long and whose white has come out slightly through the top of the shell). And there the story stops. The gold and the metals that accompany it stay put, hence the three signatures of the model: a bismuth-tungsten-molybdenum mix (the metals that travel with gold when the source is magmatic and that also concentrate in the liquid). The grades are low but consistent, which makes it a signature. The vertical extension is however bounded compared to orogeny (the gold never descends lower than the pluton that expelled it). Summary: IRGS = an egg that cooked enough to break the eggshell, with cooked egg white that intruded because of the pressure but stayed close. The difference to remember versus the orogenic model: the seismic pump reactivates as long as the collision lasts, while a pluton exudes only once.
The verdict of the Qualified Person
Right. And Cabral in all this?
Let’s ask the QP (Qualified Person, the accredited geologist who puts his license on the line for the estimate)1. The verdict: orogenic (it hasn’t changed from 2022 to 2025). For him, it’s the seismic-pump scenario that switched on during the Trans-Amazonian orogeny (about 2 billion years ago, when West Africa was still its neighbor). The deposits would have formed between 6 and 12 km under the surface, and two billion years of erosion had the courtesy of bringing them back up within reach of the drill.
I could say “trust him”, but this global mental picture is precisely what the market doesn’t have. So I owe you a full justification.
Here, we have five observations in support:
The rock that hosts the gold cooked at depth, and its degree of cooking can be measured (that’s the regional metamorphism): consistent with a formation several kilometers under the surface (therefore, orogenic).
The gold cuts across several generations of granites. If a pluton were its father, the gold would stay glued to this pluton, like the white around its egg. That does not seem to be the case.
Almost all the zones carry high-grade shear veins. Translation: veins born in moving faults (the territory of the pump).
The veins are banded and laminated layer by layer. The vein quartz was laid down in stacked layers like tree rings, and the rock around it was broken, re-welded, then re-broken and re-welded again and again (”polyphase breccias” in the jargon). If you have followed: each layer is a stroke of the pump and the rock kept the count.
Last observation, the most disputed: almost no trace of the magmatic model. There is indeed molybdenite and scheelite at Machichie (the indicator minerals of molybdenum and tungsten that you find in the metallic juice with the gold in IRGS), but neither correlates with grade. Roughly, where these traces exist, the gold does not follow them.
So much for the QP’s reading. But reading rock is not quite an exact science for a human. The opposite camp reads these same minerals completely differently, and to be fair, they have a point.
First, they do not agree on the interpretation of the presence of this molybdenite/scheelite. The mineralization is entirely housed in granites, exactly where the egg white that came out of the shell would go. What’s more, scheelite is one of the standard IRGS indicators in Hart & Goldfarb (the authors of the model). Nothing decisive either.
What do the neighbors think of it? G Mining classes Tocantinzinho as IRGS while Biondi and his co-authors argue there’s nothing to rule out reading it as orogenic. To summarize, the debate still runs across the whole province, and it’s far from settled.
The ceiling and the free hypothesis
What does it change for Cuiú Cuiú? The ceiling.
A pump promises a relatively vertical continuity: similar camps get mined at 1, 2, even 3 km under the surface. Currently, the deepest hole of Cuiú Cuiú stops at 430 m (it was still mineralized when the drilling stopped, “open” in the jargon). If it is indeed a pump, the current 1.2 Moz would only be the upper floor. An egg makes a very different promise: mass around the pluton, and on the periphery potentially a copper-molybdenum bonus (porphyry: the class of giant low-grade copper-gold deposits).
Now, Cuiú Cuiú conveniently ticks boxes on both sides. The pump has its five observations but the egg has its own clues too. It’s just that none has ever been drilled:
At Central and PDM (two deposits of the district), the drill intersected diorite porphyry dykes (blades of magma injected into the host rock), the kind of fingers that escape from a bigger mass that stayed below (our famous pluton).
North of Machichie, coarse molybdenite and scheelite concentrate around a protrusion of granite that pierces the basement.
To sow even more doubt, this protrusion sits on a magnetic low (which could be the signature of a buried pluton).
If I translate: something magmatic probably sleeps under the north corner of the district, but nobody has ever gone to verify.
To hammer the point home: 2.5 km from Tocantinzinho, a target named Santa Patricia shows an 8 km copper-in-soil anomaly. Serabi is already drilling copper-gold-molybdenum porphyries on its Matilda target. The whole province is starting to show signs of buried eggs, and if these egg pieces exist, they’d add to the thesis (extra metal on top of the gold already counted). Obviously I pay nothing for this porphyry hypothesis, and neither does the model.
But know that the possibility exists, that it is free, on ground already paid for. For the mine under construction, it changes almost nothing. The geologists’ debate fixes the ceiling of the district but the mine runs the same either way, whoever wins.
3.2 Where the gold sits, and how you look for it
Very interesting, the geological debates, but where to look for the gold in these 306 km² then? The answer comes down to two simple ideas, plus one tool.
Idea one: the gold follows the pipes, and the pipes have a predictable geometry. The magnetic map of the district says everything at a glance.
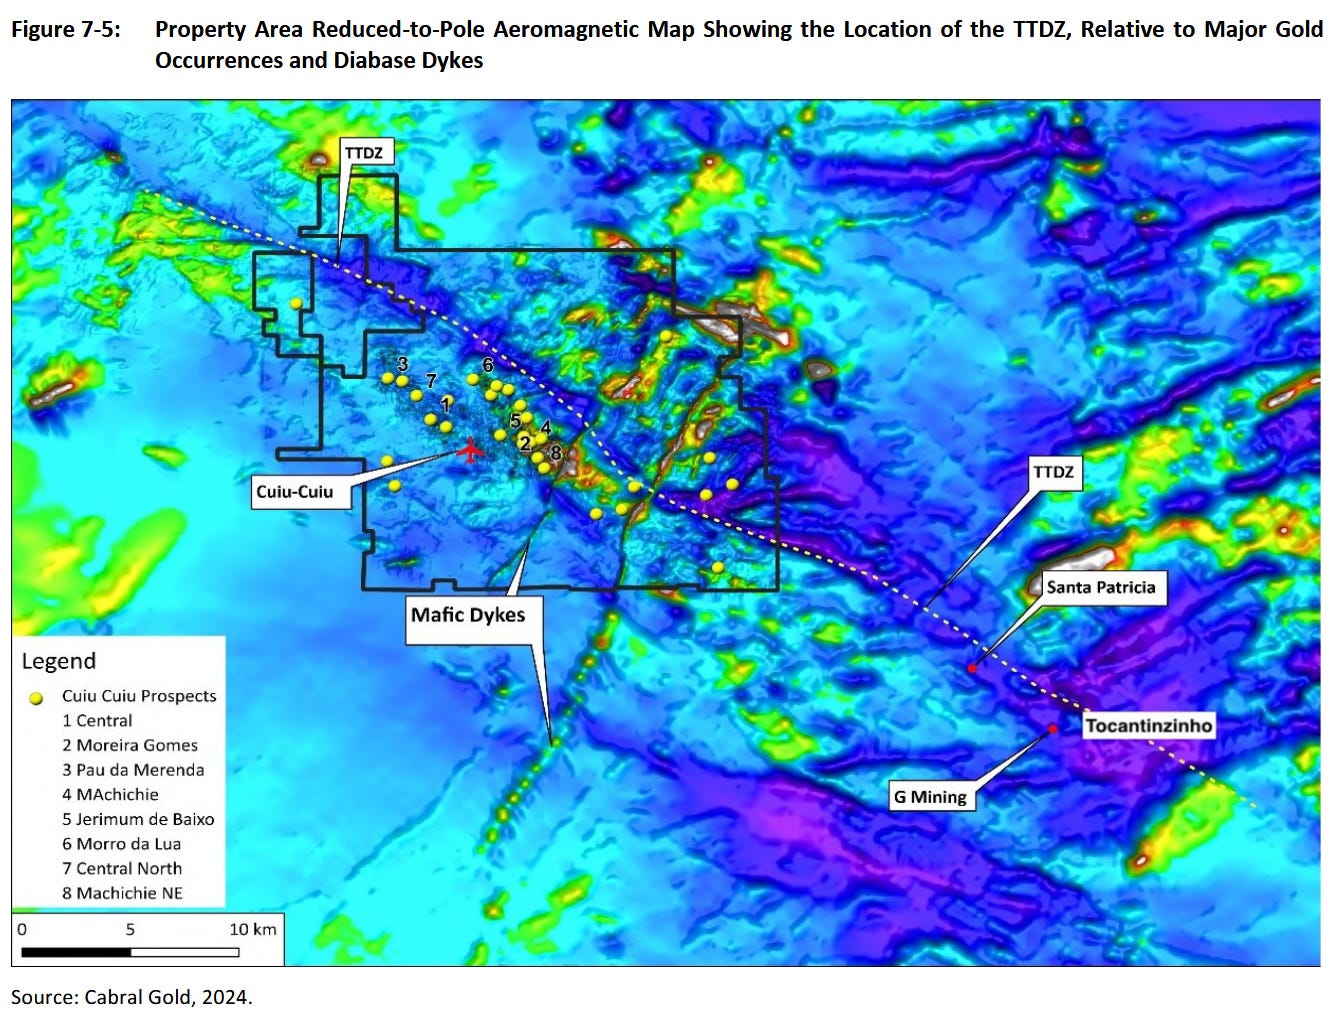
The trunk jumps right out at you. That dotted line crossing the package on the diagonal corresponds to the TTDZ of Part 2. An attentive eye will notice it follows a deep-blue band (an extinguished magnetic signal, more on that in a second). Then come the beads, those yellow points (the deposits) that cluster along this thread.
You will notice that these deposits are slightly on the periphery of the trunk. When two blocks of crust slide along such a trunk, secondary breaks open at an angle, like the oblique tears you get when you slide two plates with dough between them. These are the branches (the “splays”, in the jargon), and here they are oriented E-W. It’s these branches that carry deposits like MG, Machichie and Jerimum Cima. The magnetic zoom on MG and Machichie clearly shows these extinguished (blue) bands that follow the E-W orientation.
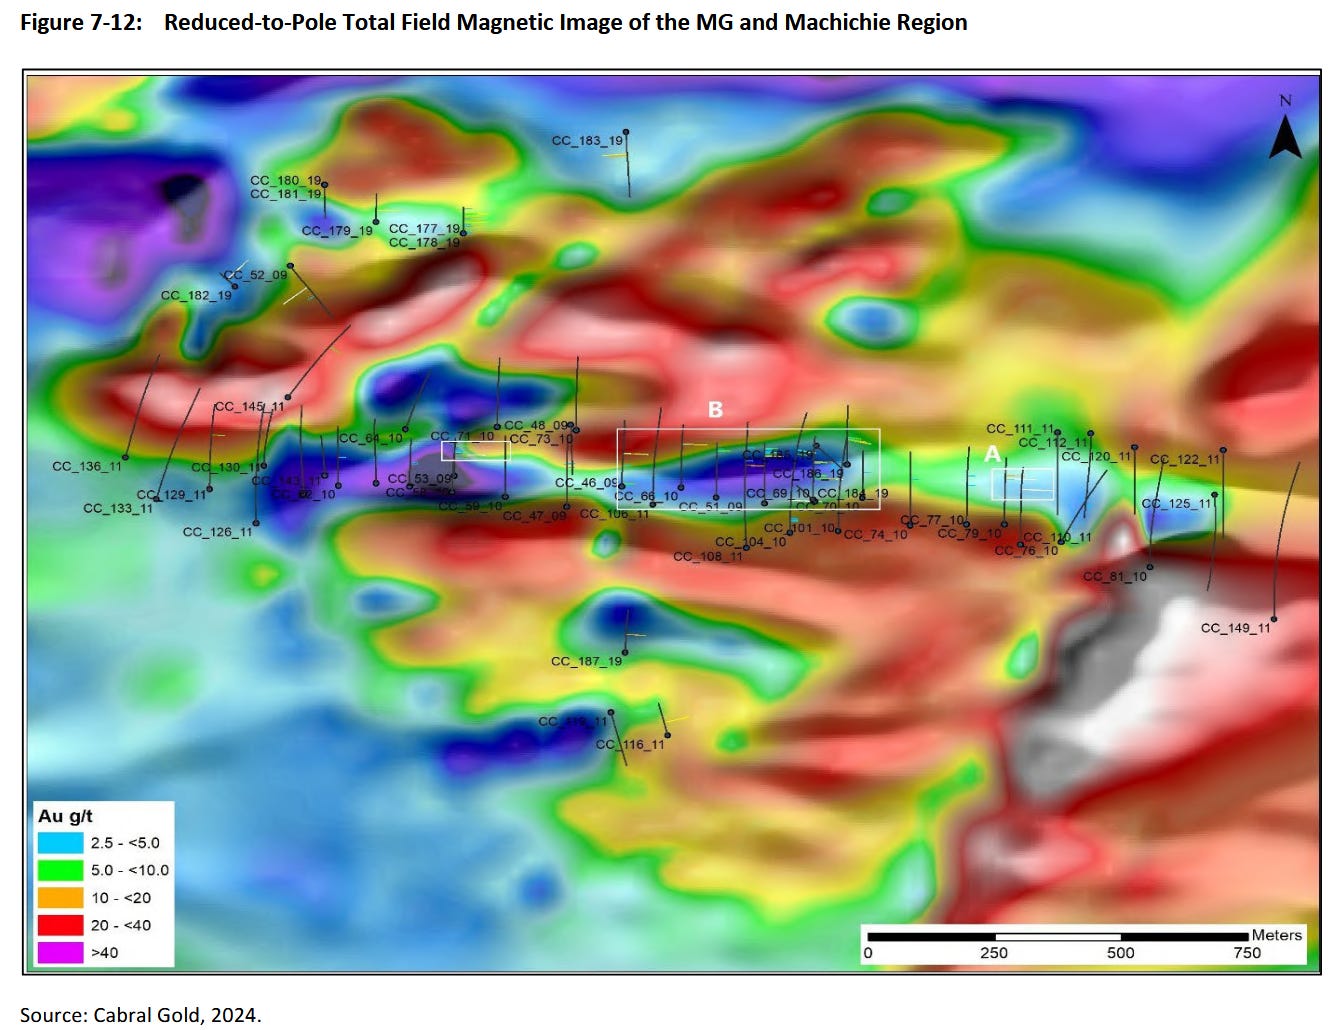
If I translate all that into investor language: the deposits line up along two directions, each predicting the other. Find the line, and it tells you where to drill next. Shorter still: the gold follows two known lines, and you can see them on a map.
Idea two: the more the rock has suffered, the richer it is. It’s granite, and granite is too rigid to fold, so it breaks. The more it broke, then re-broke (the breccias of 3.1), the more often the fluid passed, and the more that transformed the rock at depth (i.e., gently depositing gold). We need extremely complex chemistry, so hold on: gold stays dissolved as long as it does not meet iron. When the fluid meets iron, it turns it into pyrite, and the gold drops out with it. There, I hope you were holding on well. Let’s now apply this very complex chemistry.
Central (a deposit of Cuiú Cuiú) is wrapped in large red halos, tinted by a barren iron oxide. See it as the pantry. The iron there was consumed, and the gold dropped out next to it as grey pyrite. Same logic for the blades of dark rock that cross the zones (the dykes), barren themselves, but rich in iron, where their edges trap the gold. Summary: look for the broken rock, and look for the iron. The gold is right next to it.
All that remains is to find the broken rock and the iron.
It’s time to make all this geology pay:
The basement granite (everything that is under the saprolite, therefore what interests us for Phase 2) contains magnetite, a mineral that is... magnetic. Fresh rock therefore emits a measurable magnetic signal.
The fluid that deposited the gold also destroyed the magnetite on its way (during the transformation into pyrite).
Therefore everywhere the gold passed, the rock lost its magnetism.
Fly over the jungle with a magnetometer and the gold corridors show up on their own in “extinguished” bands on the map (those deep-blue bands).
Icing on the cake: the more extinguished the signal, the more the rock was transformed, and therefore the higher the grade (it’s more a correlation than a direct causation).
So far we’ve reasoned at the scale of the whole structure. But this tool offers much finer granularity. Since 2025, Cabral flies this magnetometer under a drone (therefore finer than the old airborne survey). The drone has already revealed two unknown faults that frame the Central-Mutum-PDM corridor.
The rock does not outcrop, so nothing is visible to the naked eye from the surface. But thanks to the geological structure itself, the magnetometer replaces the hammer and the eye of the prospector. That’s why the targets number in the dozens. Cabral literally owns a machine for targeting the 306 km² of the package. Thank you James Maxwell.
3.3 The weathering profile layer by layer, and its economics
Now for the pure vertical. Here is the vertical cross-section that governs the project (it’s an example from the PDM deposit, but fairly representative).
Remember, the tropical climate rotted the top of the deposit in place and this rot changes character as you go down. Let’s follow the drill down through four layers.
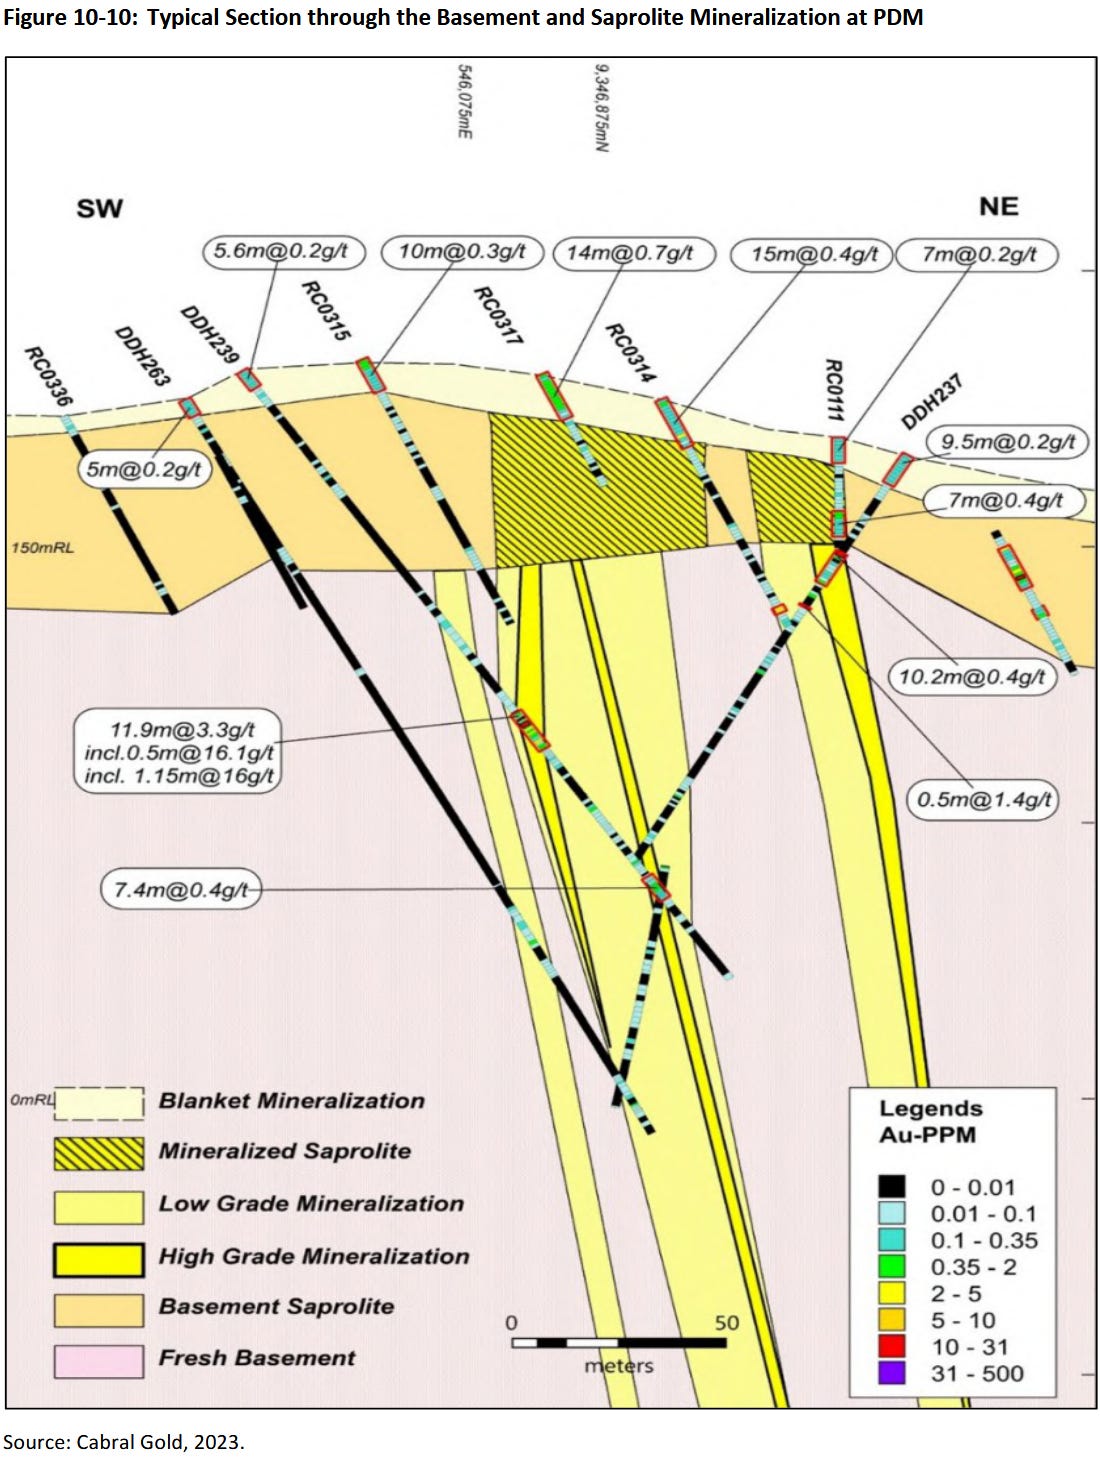
3.3.1 The blanket
See it as a rug thrown at random over a parquet floor. The rug is made of whatever’s around it, literally. Slope debris, sediments, even the old tailings of not-very-conscientious artisanal miners. A far-from-uniform rug, 0 to 40 m thick (much less on average).
The pattern of the rug says nothing at all about the floorboards below, there is almost no continuity between the two (”unconformable”, say the geologists). It’s even a bit of a liar, frankly: the rug widens to more than five times the width of the floorboard zone below. So the rug in no way implies floorboards below. Let me repeat: the rug does not imply the presence of floorboards below.
For the material itself, it is not very dense: about 1.6 t/m³ in the model for the blanket (the bulk density measured in columns even drops toward 1.0), against more than 2.7 for the granite below. About 0.35 to 0.5 g/t of gold you can mine with a shovel. It’s the surface so zero waste to move, and it leaches very well (cyanide that flows along the heaps to recover the gold at the bottom, filtered coffee) with 88-91% design recovery at MG and Central.
Only one nasty by-product turned up: pockets of lake clay. Nasty because too fine to stack without plugging the heap (the cardinal sin of a heap leach, we’ll obviously come back to it). The mine plan sends these localized pockets directly to waste, gold included (the cost is trivial, it’s the right choice).
3.3.2 The saprolite
The heart of Phase 1, down to 60 to 80 m depending on the deposit.
These are the floorboards. They were there before the rug, but they too have rotted. The hard minerals became clayey, the sulfides became iron oxides (that again), but the rock still kept its overall geometry (same direction, same dip, same thicknesses). See it as a photocopy of the hard body below, but softer. The CEO insists on it: the mud “has the same gold content as the underlying rock”. It also keeps the grade, or even improves it. I use the active voice on purpose: weathering itself removes part of the barren rock but leaves the gold in place (sometimes with a bonus of gold redeposited by surface waters). Here too a shovel will do, still no crushing-grinding.
But it remains clay. Make big heaps of it and it plugs. If it plugs, the cyanide does not flow and the gold stays stuck. The solution is therefore to knead the clay with cement before stacking, in order to glue the fines into permeable granules (agglomeration) which, in turn, are kind enough to let the cyanide (and the gold) through. Recovery varies a lot by deposit, from 90.5% at MG to 72.5% at Central. Careful, these are design recoveries; reality could be harsher, or kinder. We’ll come back to it at length in Part 5.
3.3.3 The saprock
It’s a transition layer between the saprolite and the hard rock below (the rock literally hardens as you go down). It’s not always present, and its thickness varies (a few meters up to 20 m at Central). Nothing economic in it under the current plan, it’s pure waste to move.
3.3.4 The fresh rock
At last.
Below 60-100 m. The density approaches or even exceeds 3. You therefore have to drill, blast, crush and grind. Once ground, the gold gets recovered in two ways. Half by gravity (the coarse gold separates out by density) and the rest by CIL (carbon-in-leach).
CIL is the heavy and industrial version of Phase 1’s cyanidation. We go from filtered coffee to filtered beer. You grind the rock into fine powder that you then stir into a cyanide solution in big tanks (beer). The laws of physics don’t change from one tank to the next, so the gold dissolves here too, and you throw activated carbon (the sponge) straight into the tank. The carbon captures the gold as it goes; all that’s left is to wring the sponge to recover the gold. Here it’s much faster and more efficient than Phase 1, with lab recovery rates of 90-97% (just a guide, not the design number). But we’re talking about a real plant; it’s much more expensive than a heap and a liner. That is Phase 2, the 2027 PEA and the 75-80% of oz already counted (which therefore excludes all the potential oz of the district thesis).
Two quick notes before we head back up to the surface.
Nature literally spent millions of years crushing and pre-grinding the top of the deposit. Phase 1’s US$37.7M of CapEx is just that free work, cashed in.
The second is a bonus hunting tool. The speed at which a rock rots depends on what it contains, in our case, pyrite. When pyrite meets rainwater and oxygen, it oxidizes and makes sulfuric acid. This acid attacks the rock much harder than the rain alone, diminishing the density. So above a mineralized zone, the rot reaches deeper than normal. And the reverse is also true: a barren dyke without pyrite holds up better, and so the rotted layer thins there. You can therefore literally map the depth of the mud to guess where the mineralized zones sit below. To summarize, an abnormally deep saprolite is a clue to ore below. Even the mud does geophysics.
3.4 The inventory of Cuiú Cuiú
3.4.1 The official total: 1,138 koz, 2022 vintage
We’ve built up enough theory to move to practice. Over to the deposits.
According to the 2022 MRE (Mineral Resource Estimate, the official resource estimate):
604.0 koz Indicated (21.6 Mt @ 0.87 g/t)
+ 534.5 koz Inferred (19.8 Mt @ 0.84 g/t)
= about 1,138.5 koz over five modeled deposits, of which 232.9 koz in oxide and the remaining 905 koz in fresh rock.
Inferred: you extrapolate between the holes (up to 100 m beyond the last hole), these are resources you’re legally barred from booking as reserves.
Indicated: the extrapolation is more limited (50 m or less, here) and you’re allowed to hang engineering on it.
Above that again sits Measured, but Cuiú Cuiú doesn’t have a single ounce of it yet.
We were talking about 2 Moz out of the rivers, whose source in rock remains to be found. And here, we are not even at 1.2 Moz counting the oxide, without a single Measured ounce. Let’s square all this.
First, 2022 is old. Only the oxide of MG, Central and Machichie was re-estimated for the PFS. The primary, for its part, stayed frozen at 2022. So on top of being potentially underestimated relative to what the district can offer, the official estimates aren’t even up to date. Hang on to that detail.
Phase 1’s reserves are all oxide and all probable: MG 82,912 oz, Central 29,959 oz, Machichie 16,032 oz. 6,178 kt @ 0.65 g/t = 128,903 oz. And a global update, targeted for the end of 2026, that has to redo everything across six or seven deposits. So even the oxide resources aren’t up to date, and soon will be. It’s even one of the big potential short-term catalysts.
All of this obviously ignores every target not yet drilled. The district-scale thesis is a matter of years.
3.4.2 Deposit by deposit
Time for the guided tour, from ripest to greenest.
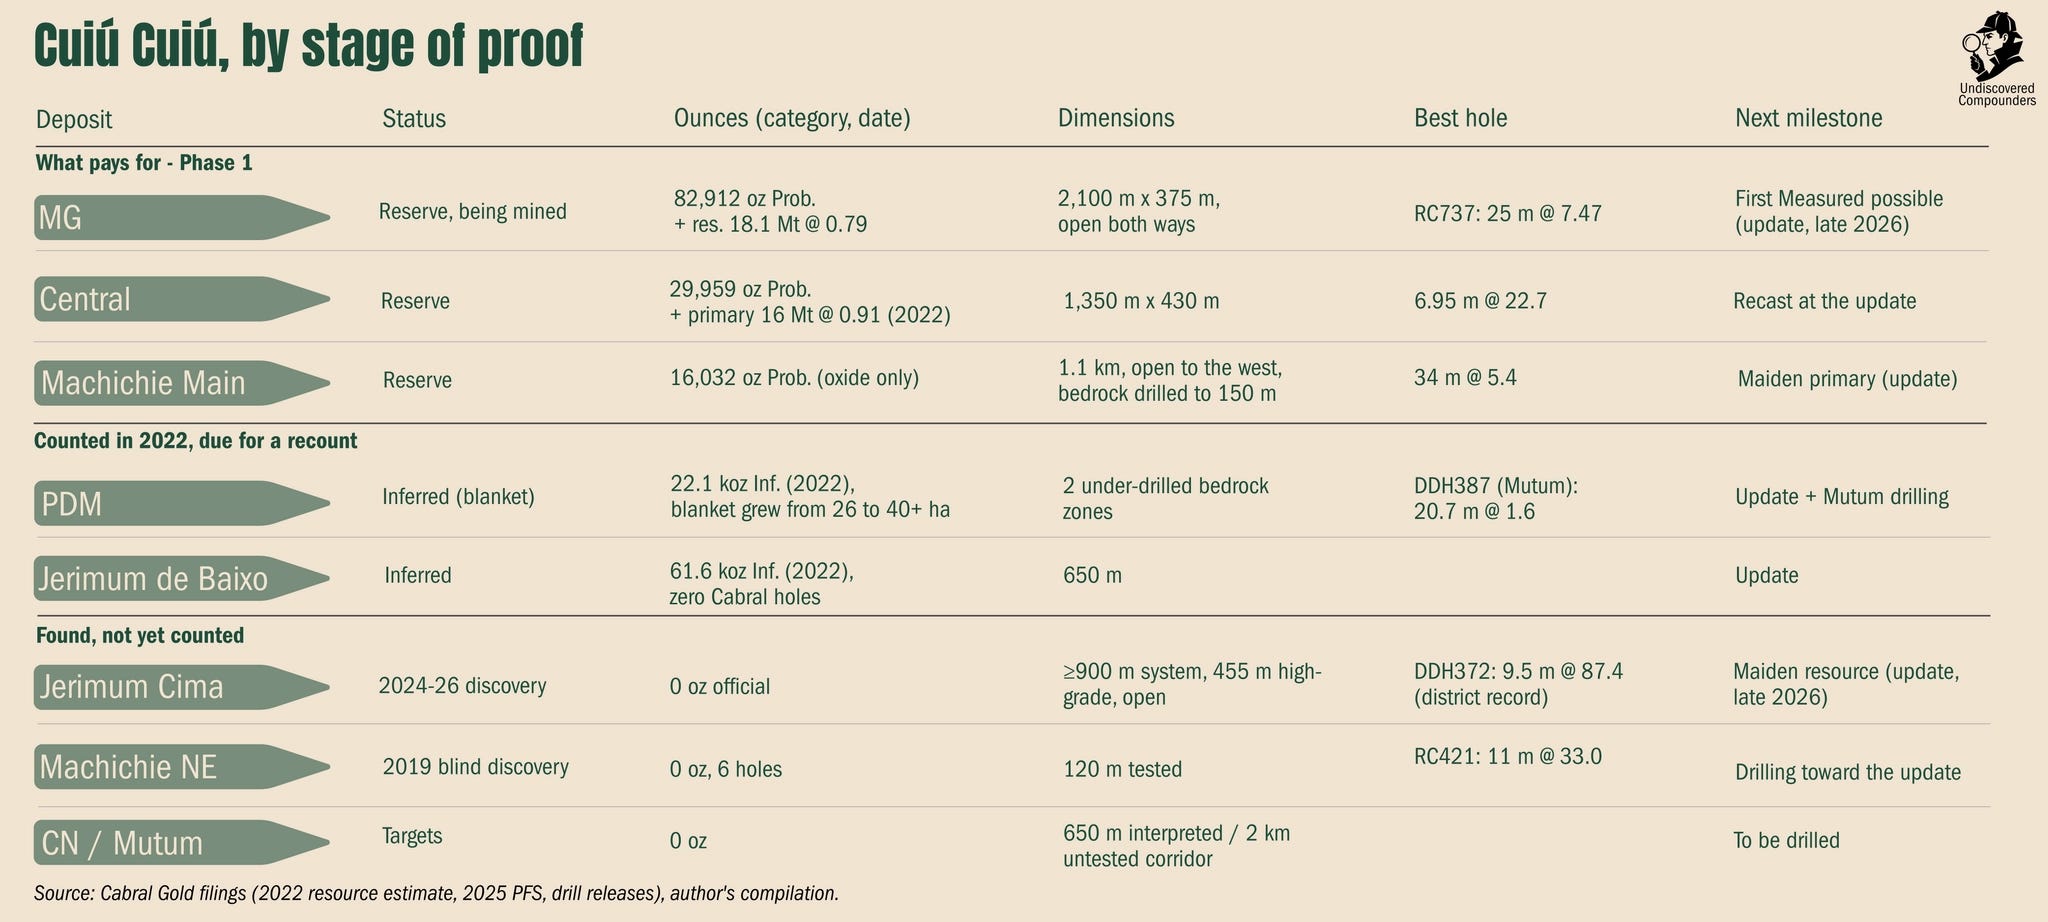
MG (the flagship): the district’s template architecture (a lattice at roughly 1 g/t with rich veins inside). The 2026 infill (drilling between the existing holes) confirms the model in aggregate (”in line with expectations”, per the company, on 125 holes published, 41 still pending), with standouts far above. It’s MG that roughly pays the next five years, and its mining started July 9 (guided for end June, so one week late, immaterial).
Central (the veteran): it’s the deposit where the garimpeiros scratched the surface the most, the one where the drill went deepest in the district (430 m, still mineralized), and the one that already carries the biggest hard-rock resource. It is in the mine plan and we already know that its saprolite is the worst-leaching ore of the project.
Machichie Main (the MG clone): “remarkably similar”, according to management, with the egg clues of 3.1 and the most visible gold on the property. Its basement is drilled only to 150 m: the clone still has to be confirmed at depth.
PDM (the 2026 surprise): its rug is growing, and above all the drill snagged Mutum, a never-tested basement zone in an almost untouched 2 km corridor (right on a fault the drone had just revealed, thank you James Maxwell).
Jerimum de Baixo (the sleeper): counted in 2022, never drilled by Cabral since. The update will say what it’s worth, if it’s worth anything.
Jerimum Cima (the headline magnet): the best hole ever drilled in the district, an open system, and zero official ounces. Its whole case hinges on the end-2026 maiden resource. Very probably a hit or miss.
Machichie NE (the blind discovery): nothing at surface, with spectacular but scattered holes. But only six holes, at this stage it’s more an argument than a deposit.
CN and Mutum (the targets): interpretation, clues, and drilling to come.
To summarize:
three deposits pay Phase 1 for now,
four others await their first official number end 2026,
and discoveries that keep coming at a steady clip (Machichie NE 2019, Jerimum Cima 2024, Mutum 2026),
and that could even accelerate if Phase 1’s cash flow arrives (more than 50 potential targets).
As for the speed, the cost, and the drilling, that’s for Part 6.
3.5 The two grade populations
On one side, rich veins at 87 g/t (no, it’s not a typo), on the other, an average grade of 0.65 g/t for the reserves.
First, the district contains two types of grade populations (like Tocantinzinho):
a homogeneous background running at 1-2 g/t in fairly wide breccias (the MG envelope “averaging about 1 g/t”, Jerimum Cima’s 82.6 m @ 1.0);
and thin but ultra-rich columns (for example, the 87 g/t).
Even averaging the two populations, you don’t land on 0.65. Two ingredients are missing. First, dilution: a shovel doesn’t mine with a scalpel; recovering the rich veins means taking the lean halo around them and a little waste at the edges (we explained it in Part 2). Then, and above all, the economics: at the pit plan’s gold price, even mud at 0.35 g/t pays its way and more. So the pit takes tonnes of it, deliberately, and each lean-but-profitable tonne that improves the economics drags the average down. Hence the 0.65.
This average is also (and above all) a schedule. The richest zones first (even diluted), coming out at about 1 g/t. The leanest wait for end of life. Result: about 0.97 g/t fed in year 1, 0.77 in year 2, then a slope that ends toward 0.45-0.65. For the why, it’s almost always the same reason: time value. A higher-margin dollar in year 1 is worth more than in year 6.
A small subtlety here: the nugget effect. Picture the gold in the rich veins as a raisin cake (as opposed to a plain sponge cake, nicely uniform if made by a conscientious pastry chef). Now, a lab assay only tastes a minuscule slice of the whole cake. Put another way, most slices probably miss the raisin, and the average of the assays understates the true grade of these veins. The QP spells it out, and the standouts of the 2026 pre-production infill at MG (far above the model) point the same way, even if the aggregate of the 125 holes comes out demurely “in line with expectations”.
3.6 Why 75-80% of the ounces are in the hard rock
The arithmetic first. In the 2022 MRE, the oxide carries 232.9 koz out of 1,138.5, or 20.5%. The rest, 79.5%, is fresh rock buried under the floorboards.
The 2024-25 oxide additions bring the split back toward the “about 75%” that management cites (logical: only the oxide has been re-counted since 2022, Phase 1 needed its reserves; the primary still awaits its turn). The asymmetry in proportion is purely anatomical: the oxide is the skin of the deposit, the hard bodies are its skeleton. A skin has a capped thickness (about 60 to 80 m). The skeleton, for its part, is vertical: it goes down as far as the drill has gone, 375 to 430 m depending on the deposit, and further still. For the same footprint, the skeleton’s volume dwarfs the skin’s, inherently. The sketch in 3.3 says all this at a glance.
This distribution is a kind of ceiling. The oxide is relatively easy to find and measure compared with the primary. Whereas for a volume of oxide already found, there’s almost certainly more primary still to discover. Each deep drilling campaign adds ounces to the primary. Phase 1 therefore funds the X-ray of a Phase 2 that’s still of unknown size.
3.7 The 2022 correction
I hope you remember that the presence of a rug does not necessarily imply the presence of floorboards below, because it’s time to tell the story of those who forgot it.
Until 2021, Cabral “lived” on inherited models (a 2011 estimate, reworked in 2018). Here’s the horror show, in four acts (squeamish geologists, look away):
drill collars positioned by compass (with errors going up to 35 m!);
basement grades projected up toward the surface through a saprolite that had never been drilled;
the reverse, rug grades magically projected down into the floorboards;
“default” densities, straight out of the manuals.
Management knew it had to rebuild the models and carried out a complete rebuild in 2022 (drill collars re-surveyed by GPS, saprolite drilled systematically, densities finally measured). The results were not kind: several basement zones in the model “did not exist”. The rug’s spread had created phantom ounces.
But it was for the best. The purge that killed these phantom ounces gave birth to new ones. The re-modeling made the Indicated jump 253% (to 604 koz) and isolated for the first time a leachable oxide resource of 15.4 Mt @ 0.47 (233 koz), which Carter said at the time “could be a game changer for early low-cost development”. He clearly had a nose for it. In four years these resources went through two PFS studies and the mine is under construction. Phase 1, even the whole plan, was literally born from an error correction.
I draw three things from this story:
The origin of the two-phase strategy is geological first, financial second. Without the discovery of the rug-floorboard unconformity, nobody would have isolated the oxide, and there would be no Phase 1 (and therefore not this deep dive).
Management discovered that its inherited resources were in part fictional. It wrote it in black and white and rebuilt on top. The timing surely played a part; notably, the update was demanded by the BCSC (the British Columbia market cop). But the purge itself, and what it turned up, is to their credit. As a potential shareholder doing his homework, I want to see exactly this: a model born from a methodological purge.
The permanent caveat is that each new rug (PDM, Jerimum Cima) will carry the same ambiguity until its floorboards are drilled in their own right.
At Cuiú Cuiú, the root proves out hole by hole. And that’s exactly what Phase 1’s cash is meant to pay for.
4. Phase 1: the cash machine, as the PFS describes it
4.1 Heap leaching
We need to talk again about the filtered coffee and the beer. Quick recap, just in case.
Phase 1 (the filtered coffee of Part 1): you stack the agglomerated saprolite on a liner, you bombard it with cyanide that percolates and comes out charged with gold at the bottom. You run the whole thing through columns filled with carbon downstream of the heap (the sponge waits for the gold at the drain). The industry calls that carbon-in-column (CIC).
Phase 2 (the beer of 3.3.4): here you have tanks filled with ground slurry (the rock was too hard). You can’t filter it cleanly enough to run it through columns, so you throw carbon directly into the tank. You stir it so it captures the gold in place, then you recover it with a screen (the carbon grains are bigger than the ground rock). The industry calls that carbon-in-leach (CIL).
As a potential shareholder, what interests me is also what isn’t there. No mill, no agitation tanks, and above all no tailings dam (the toxic mud lake of conventional plants, an operational and permitting nightmare all by itself). For Cabral, we have a minimalist heap-leach plant that transforms 0.65 g/t ore into margin on one single condition: that the cyanide solution reaches all the way down.
Cabral has a few quirks that affect this flow:
This clayey, wet saprolite. A simple mineral sizer that breaks up the clods under a 50 mm grid and that’s all. Nature already paid for the crusher (3.3).
Despite that, the clay would plug the heap if you stacked it as-is (and we really do not want that). So everything goes through an agglomeration drum with 10-15 kg of cement per tonne to glue the fines into permeable granules.
The norm in the industry is to have a permanent pad on which you stack layers of ore successively. You start with a first lift of about 10 m, you leach it then you leave it there. You add the next one on top, you leach and you let it flow. And you start again for years, sometimes ending up with heaps 150 m tall. The advantage is enormous: zero unloading, one single liner amortized over years, and the old lifts even keep yielding residual gold along the way. Cabral cannot do that. The heap would plug too fast. The solution was to have four cells on which you add ore (about 100k tonnes per cell), you let it leach 60 days (120 days with rinsing, unloading, etc.) and the spent ore goes to the stockpile and you start again with a new heap on the same cells.
The on/off has an obvious cost: permanent double handling (load, unload, start again). But it’s in my opinion an enormous advantage for a management that has never operated a mine before: each cell is a 60-day chance to experiment, at a far lower cost of error than a permanent pad. Management has plenty of chances to optimize its cement recipe, the height, etc., everything that repeats from one cycle to the next. Summary: less efficient, but more forgiving. For a first build, which must serve to finance a bigger one afterward, it’s the best trade-off.
4.2 The numbers behind this leach
We have enough background to interpret the latest official numbers (Ausenco’s updated PFS, effective July 2025):
The reserves:
6,178 kt @ 0.65 g/t = 128,903 probable oz, 100% oxide, spread over three pits (MG 82.9 koz, Central 30.0, Machichie 16.0);
Pits designed with gold at $2,250/oz ($2,220 net of refiner charges) and a Brazilian real at 5.75.
Plant at 1.0 Mt/yr nominal, with 6.2 years of life;
Strip ratio 0.78: less than one tonne of waste per tonne of ore, the gift of 3.3 (elsewhere, this ratio runs to multiples);
Mining contracted out (no fleet to buy, more CapEx avoided);
Recovery: 85.4% in weighted design, 87.8% in the cash-flow model. The gap with the design is a matter of weighting (we will come back to it in depth in Part 5);
Life-of-mine production: 113.2 koz recovered, 112.6 koz payable (99.5% after refining deductions).
The costs:
Initial CapEx of US$37.7M, one of the smallest I have ever seen (thank you, 100 million years of free grinding). US$8M of sustaining over the life and US$1.1M for closure.
OpEx: mining $3.50/t, Central→MG haulage $1.41/t, processing $10.00/t, G&A $1.5M/yr. Total: about $18/t processed, or about $994/oz of site cost.
AISC: $1,209.9/oz on the base deck (the deck: the study’s set of price assumptions), $1,243.5 on the spot case;
Royalties: 4% of gross revenue (Brazilian CFEM 1.5% + Osisko 1.0% + Versamet 1.5%), or about $99/oz at $2,500 gold and $132/oz at $3,340. The first is mandatory; the third, rather good news. We will talk about it in detail in Part 7.
The total economics:
At $2,500/oz, we have an NPV of $73.9M, an IRR of 77.8% and a payback in 0.85 years.
At $3,340/oz we have an NPV of $137.8M, an IRR of 139.3% and a payback in 0.6 years.
At current spot (my quick estimate extrapolated from the PFS sensitivities): at $4,000/oz we have an NPV of about $200M and a payback probably near 0.4 years.
The study is one year old and even its bull case is below the current spot after a strong retracement. At current spot, give or take a few tens of millions, the market cap covers the mine and throws in the district for free. That’s what I call good optionality.
One important caveat: the 77.8% IRR assumes a CapEx that’s already financed and committed. The gold loan has been drawn since November 2025, construction is well advanced (85% at July 9), and 90%-plus of the costs are locked at firm prices.
Financing risk has all but disappeared for Phase 1. Construction execution risk is significantly reduced. Production is coming. One of the best zones, if not the best zone, of the Lassonde curve.
4.3 The front-loading of the cash flows
The mining sequence attacks MG first, Machichie in the second year, and saves Central for last. On the grade fed in, that gives:
year 1: 0.97 g/t (management even guides “well above 1 g/t” over the first twelve months);
year 2: 0.77;
afterward: it diminishes down to 0.45-0.65.
And the pre-production infill adds to it: 25 m @ 7.47 g/t from surface, including 10 m @ 17.09 (the famous RC737 hole), material so rich that it will pass through a gravity circuit (the density sorting of 3.3.4) before even seeing the heap.
All that for about 36 koz recovered over the first two years, or about 32% of life-of-mine production. Year 1’s AISC comes out at $731.8/oz, still nearly 40% under the life-of-mine average. The margin on an oz at $4,000 is more than healthy.
This front-loading is the schedule’s one luxury: most of the cash arrives before the first repayment of the gold loan (March 2027) and above all before the first wet season. But this luxury depends on throughput. A throughput well below the theoretical figure can literally break the plan. It’s not the most probable case, but it clearly has its place in a bear case.
The plant is precisely sized for a 0.85 g/t grade while the reserves grade 0.65 on average. That has the advantage of being able to manage the front-loading (notably for the carbon and elution circuits). Sizing on the life average would have throttled precisely the quarters that count. And the quarters that count are above all the first ones.
4.4 Where the build stands, and the path toward first pour
State of the build at July 9, 2026: about 85% built with more than 90% of costs contracted: “on budget, on schedule” according to the CEO. The dry circuit is finished and mostly commissioned (the sizer is installed and the agglomeration drum is turning). The mining of MG started this week and the first agglomerated ore is starting to go onto pad 1.
The ADR plant (the unit that extracts the gold from the cyanide solution and pours it as doré) was tested and partially commissioned in Perth before shipment (an unusual de-risking step for a junior). It has arrived in Brazil and should be on site end of July. The water-management ponds are finished and pad 2 of 4 should finish this month (with the regulatory authorization for cyanide use finally in hand).
Big positive point: the build came through the 2025-26 rainy season (December-April) on schedule. For a first build in the middle of the Amazon, it’s a real execution data point to add to the team’s track record. On the human side: 308 people on site, 100% Brazilian, 61% of them from Pará.
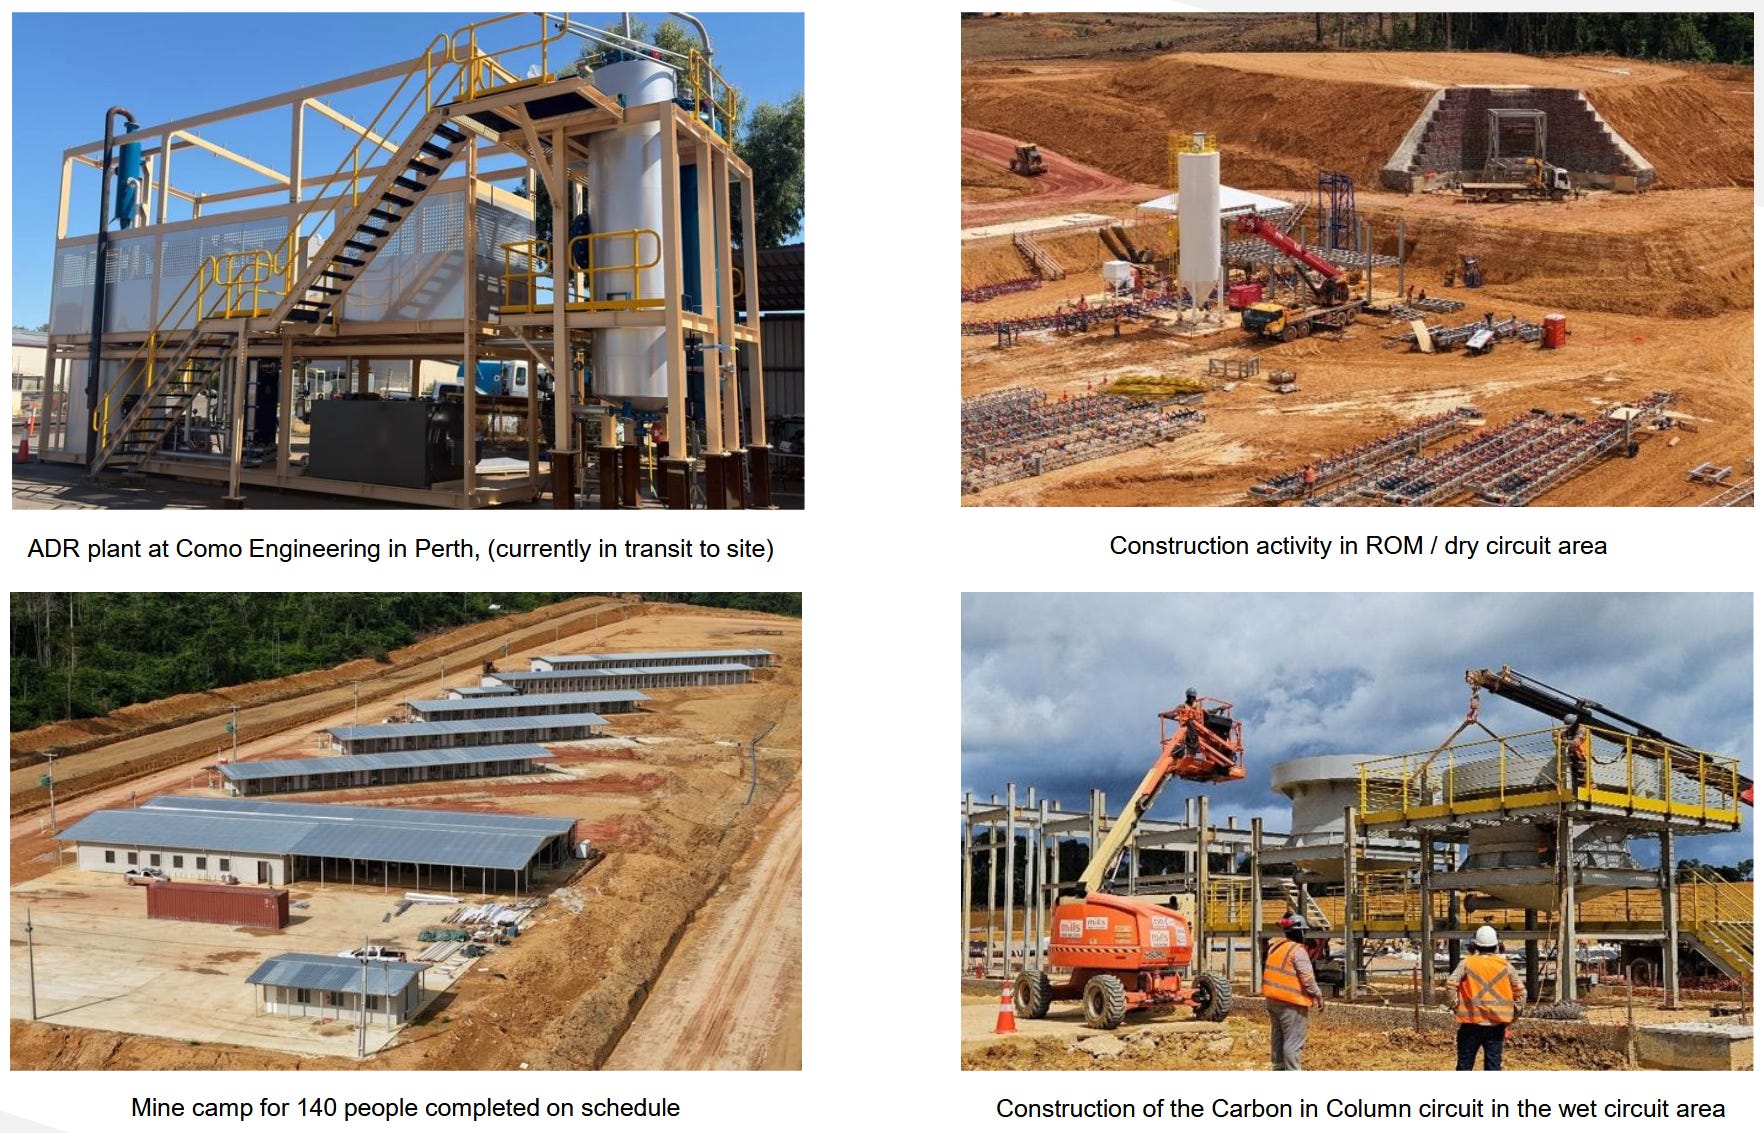
Here is the remaining path toward first pour, as guided by management:
Mining and stacking: started. Great.
ADR installation on site end of July. In principle, not a source of trouble.
Commissioning of the wet circuit in Q3, its timing depending on how the dry circuit progresses.
First gold “early in Q4”, then commercial production and ramp-up in Q4 2026.
The process is fast once launched: Machichie’s 2025 columns recover 88 to 96% of the gold in 22 to 34 day cycles. The first ounces will therefore follow the stacking very closely.
But the variables that interest us, potential shareholders, will come after this schedule. The data that confirms or dents the thesis (the real recovery by pit, the real cement dose, the behavior of the heap under the rain) only arrives between Q4-26 and the first wet season of 2027.
A functioning build does not imply a mine that works, let alone a stock that performs. That’s exactly what the next section catalogs: what can break at that point, and what the PFS itself says about it when you read it down to the appendices (more than 400 pages...). Small spoiler: it’s long, but it’s the price of an edge.
5. Metallurgy, the eternal problem explained (relatively) simply
How much gold will the heap actually give up? It’s the tens-of-millions-of-dollars question of this Part 5.
Management announces 88% average recovery, and the few write-ups out there repeat the number and call it “conservative”. The number is “honest”: it comes straight out of the PFS. But “conservative” clearly doesn’t survive a read of Section 13 and its test appendices (how many shareholders actually read them?). What you find there is less flattering and above all more interesting:
a global design at 85.4%, but calibrated to a hair on laboratory columns, without a scale-up cushion;
a few weak spots conveniently parked at the end of mine life;
and one decisive piece of data that the company generated but never published.
We are going to take all that apart, piece by piece. It’s the most technical section of the report, but it’s there that you earn the right to have a real opinion on Phase 1, and on its capacity to finance Phase 2, so roughly the whole thesis. Let’s go.
5.1 Two numbers vs reality
Take a tube of one or two meters and fill it with agglomerated ore. Lovingly irrigate it with cyanide for weeks and measure the gold that comes out at the bottom. That’s the process behind every recovery number we’re going to talk about here.
The PFS gives two numbers:
“85.4%”: the design average weighted by tonnes and built domain by domain: MG blanket 88%, MG saprolite 90.5%, Central blanket 91%, Central saprolite 72.5%, Machichie 88%.
“87.8%”: the recovery the cash-flow model achieves over the mine’s life, or 113 koz recovered (out of 129 contained). The gap with the design is a simple matter of weighting: 85.4% is tonnes-weighted, 87.8% ounces-weighted. Now, the ounces live mostly in the domains that leach well. Round, and you have the “88%” that management often trots out.
What interests us is what these numbers assume.
The key parameter of the model is the solution-to-ore ratio: how many liters of cyanide you run per kilo of ore. Naturally, the more you rinse, the more you recover. Now, a real heap will only receive 2.4 L/kg over its 60-day cycle. The design takes it into account, and honestly, fairly cleanly:
it keeps only the 2024-25 campaigns (the ones where the agglomeration recipe was dialed in, unlike the 2023 tests, which were fairly... questionable[^1]);
it reads each column at the exact point of the real plan (60 days, 2.4:1) rather than at its final number, which would surely have flattered the result;
then it knocks off 1% for process losses (because you never know).
As a shareholder, my problem is what the design does not do. A laboratory column is a “perfect” miniature heap. A heap agglomerated with tender care by a technician, watered uniformly to the mL. The column is never compacted under five meters of ore, let alone by machinery driving over it. In short, a commercial heap has dead zones that its lab miniature doesn’t reproduce (all models are wrong, but some are useful).
The industry knows it and has sought to measure this lab-to-field gap for a long time, and Kappes (the founder of the very laboratory that did these tests) had the good sense to quantify it for this class of ore: 92-95% in columns would produce “85% or greater” on a well-conducted production heap. So 7 to 10 points of discount, for the best-run heaps.
On one side we have Cabral’s design at 85.4%, on the other we have Kappes’s “well-executed” floor at 85%. To summarize: 85.4% is a good student’s score, with very little room to maneuver (hence the appeal of the on/off cells, which hugely limit the cost of error compared to a permanent pad).
And then there is Central, the last little subtlety. Its saprolite (about three quarters of the tonnage of its pit, by reconstruction from the resource mix, the reserve split not being published) leaches at 72.5% in design. No excess of conservatism here, it leached at 74-77% in columns. It’s the only domain where the design itself admits a structural weakness (the Central domain accounts for 23% of the reserve ounces). The plan directly sequenced it at the end of the mine life so that discounting does less harm to the NAV. Logical.
5.2 Percolation: where the project already had its bad news
The real risk of a clayey heap leach comes down to one condition: the heap must drink, and it is thirsty. When the fines plug somewhere, the solution doesn’t stop flowing altogether. Gravity always helps it find shortcuts, but it ends up taking only those shortcuts (it is not very original2). The gold of the zones it avoids still exists. You duly paid for it, mined it, stacked it, watered it. But it stays stuck.
One small point in the company’s favor: the permeability data is bad, and they published it anyway. Better still, the design respects it. That’s rarer than it should be, and you can probably thank the CEO’s skin in the game for that.
Let’s start with the test protocol. Again, it’s a scaled-down reproduction: you crush an agglomerated sample under the equivalent of X meters of ore, then you look at whether it still drinks. The results:
10 kg/t of cement: two of the three MG composites fail at all heights (the high-grade saprolite, for its part, holds at 5 m);
15-20 kg/t: most pass at 5 m, fail beyond;
20-35 kg/t: the best cases cap at 10-15 m;
More specifically, the Machichie blanket fails even at 5 m with 15 kg/t.
I remind you that the industry runs at 9-10 m per lift. This ore only takes 5 m. And even then, only with cement added. The single lift and the on/off of 4.1 suddenly make more sense. I have little doubt that a more... promotional management would have buried these tests in an appendix and kept the 9 m so as not to scare the market.
Good intentions are all well and good, but we’re here to produce gold. And there, the tests aren’t very kind. To summarize, the 5 m is a feasibility floor. There is no floor above and several samples needed 15-20 kg/t of cement just to pass, while the budget provides 10-15. There is probably a “liar”, and we will quantify the impact of the lie just after.
Another worry: the test is a photo. The heap is a film, a film series even, to be precise. The photo answers only one question: this material, crushed under X meters, does it drink at time T? As we saw, a heap lives and ages 60 days:
the watering detaches fines,
the current drags them toward the bottom where they accumulate in layers,
the granules soak up and soften,
and each passage of equipment packs the whole a little more.
After several stages, a heap that drank perfectly on day 1 may have plugged itself by day 30. Obviously, no static test will have seen it coming.
Let’s take a concrete case. Bald Mountain, Nevada (a Barrick Gold heap leach, one of the biggest gold giants). A successful mine with a competent operator. Yet probe holes in a pad in full operation found a thin layer of fines, next to nothing, that was making the solution stagnate. In 17 holes out of 32! The gold was waiting patiently below, and it probably waits still. If that happens to Barrick in Nevada, it can happen to a first build in the Amazon.
What to conclude from it? First, remember that the permeability of a heap is re-decided every day, at the agglomeration drum. Batch after batch. No PFS can guarantee anything in advance and as we saw, Cabral’s has no height margin to absorb a bad batch. It’s not an all-or-nothing: if it goes badly it’s “just” an erosion of the margins; and at “worst” it will need to fund itself some other way to keep financing the potential district. But I am a shareholder. And it’s the second most important point to watch in the coming months. Management knows it, besides, and even has the decency to write it: agglomeration “must be closely followed”.
The CEO said in an interview that he was so excited by this project that sometimes he could not sleep. I’d bet sleep sometimes keeps him waiting over one too-capricious agglomeration scenario.
5.3 Cement: the only reagent that can miss the budget
Cement is the glue of agglomeration, but above all, it’s a consumable.
The budget provides 11,819 tonnes per year, or 11.8 kg/t at 1 Mtpa. The design, for its part, is quoted at 10-15.
What the lab tests say of it:
2022: 24 kg/t;
2023: 10 kg/t (the questionable program);
2024: 14.8-20.1 kg/t;
2025: 14.6-15.1 kg/t.
So outside 2023, the lab never came in under 14.6. I remind you that the budget pays for 11.8. Even at 11.8 cement is among the main OpEx lines.
The sensitivity calculation is simple and I obviously built it into my model: ground that demands 18-20 kg/t instead of about 11.8 makes the cement line half again as expensive, or about $70/oz of AISC (I included the incremental diesel cost). Almost trivial at $4,000 the ounce, already more painful at $3,000.
For the connoisseurs: cyanide is here a quiet line. No sulfides that would consume the cyanide in the place of the gold. No preg-robbing (natural carbon in the ore that would act as a rival sponge, re-capturing the gold as soon as it dissolves). Arsenic is low too. In practice, the lab-to-field rule of KCA (the laboratory of the same Kappes) says that a real heap consumes 25 to 33% of what the columns consume. Applied to Cabral’s columns, the rule predicts a real need of 0.06 to 0.16 kg of cyanide per tonne. The budget allows 0.25. Plenty of headroom.
Summary: one of the main questions, but not decisive either, is how many kg of cement are consumed per tonne of ore processed.
5.4 The clays and the missing data
Everything we said in 5.3 depends on one single variable: which clay. For what interests us, there are two big possibilities:
Kaolinite, which is born from a granite rotted under a humid climate (exactly the recipe here). It doesn’t swell when mixed and docilely lets itself be glued into granules.
Smectite (think cat litter). It drinks water into its own structure while swelling, migrates, and has a tendency to re-plug the channels (the “voids” where the solution is supposed to circulate) that the cement had created. It’s a heap killer, and the prime suspect in the Bald Mountain plugging (5.2).
So, kaolinite or smectite? In what proportion? Domain by domain?
The company has the answer.
Three programs (2022, 2024, 2025) sent samples to two specialized laboratories for XRD analyses (X-ray diffraction, which identifies the mineral species) and CEC (swelling measure). Perfect, here are the results: I do not know. The PFS mentions these orders. Then nothing more. Over more than 400 pages of PFS. No clay species, no CEC value, no table. The words kaolinite and smectite literally appear nowhere in the report. And no result published in the others either, while the analysis orders themselves do appear.
Let’s reason Bayesian: a profile rotted on granite under Amazonian rain should, a priori, give dominant kaolinite. Smectite tends to show up in arid climates. Next, if the results were really bad, building the plant would be a strange choice, above all for a CEO who put several millions of his cash into the company (but not impossible, it’s been seen before). But all the same. A company that pays three times for a decisive analysis and doesn’t publish the result, you can’t give it the benefit of the doubt.
I sent an email to management to get an answer to this question. I have had no answer to this day. I will update this post if they answer me. While waiting, I owe it to you to price in this uncertainty by being hard on my estimates of the cement needed to reach the intended production.
5.5 Water: the underestimated risk
Here I stray the furthest from the consensus, because it quite simply doesn’t come up.
Let’s do a little arithmetic: 2,158 mm of rain per year on the site vs 840 mm of evaporation. Or a delta of about 1,300 mm that does not evaporate, of which 70% concentrated from December to April.3
It counts because the leach circuit is supposed to be a closed circuit. The same solution turns continuously: watered at the top, the pregnant solution recovered at the bottom, the solution poured over the carbon to recover the gold, re-dosed with cyanide, sent back up, etc. Nothing is supposed to leave it. But closed systems only exist on paper. The rain that falls on the heaps and the ponds joins the party. Four to five months per year, structurally more water will therefore come in than goes out. This surplus must leave, and as this water is cyanide-bearing, it can only leave treated.
5.5.1 Four tools, and a water balance in the future tense
The design answers with four tools:
Rain covers (raincoats for the heap), deployed in the wet season on the cells that are not in active leaching. That keeps the rainwater from getting contaminated and lets it be drained off as “clean water” before it enters the circuit. But the active cells stay open to the sky, so the rain will inevitably fall on what is being watered and will join the pregnant solution;
Five ponds (about 76,500 m³ in all4) sized for the 24-hour once-in-a-century storm, i.e. 211 mm (1/10 of the annual rain fallen in one single day). The storage calculation assumes the covers are in place.
Diversion channels around the installations (nothing surprising).
And a detox-discharge train (the chemical destruction of the cyanide with peroxide and copper sulfate, before releasing it into the environment). Surprisingly, it is presented as a backup: the installation is “zero-discharge… under typical annual climate conditions”, and the train will run “only… as required”. Typical, okay, but it’s almost certain that atypical conditions will show up for a meaningful stretch, above all in the Amazon.
One important element is missing from the list (and from the PFS), the one that would have completely changed this part: the site-wide water balance. “The site-wide water balance will determine whether treatment and discharge… are necessary”, in the future tense, and the list of recommended work adds “more detailed process and site-wide water balance is required”.
5.5.2 Three choices, in increasing order of consequence
Three choices make me raise both eyebrows.
One: the covers. The literature of the same Kappes documents their mechanical difficulty in the field (Rio Chiquito, Costa Rica: the cover “has not worked very well because of the mechanical difficulties of moving the cover”). Making them the first line of defense against a five-month monsoon is a fairly significant operational bet. If Rio Chiquito repeats here, it’s the assumption behind the storage calculation that collapses.
Two: the drip. Cabral will water its heaps by lines of pierced pipes that seep the solution without projecting it. The alternative would be to spray via a sprinkler, which disperses instead of letting flow. On the tropical projects followed by KCA, about 7% of all the pumped flow leaves again as vapor (all sources combined). That’s a little over 6 m of water/year shed for free over the watered zones. Kappes’s conclusion is that a well-designed sprinkler heap manages to hold the water balance up to 2,500 mm of rain/year. So more than falls at Cuiú Cuiú. That’s exactly why the five tropical heap leaches in his survey all irrigate that way. The drip, which Cabral chose, does the opposite. It minimizes evaporation. A virtue in an arid site, but clearly not in the Amazon. As for the reason, no idea. The word “sprinkler” appears nowhere in the PFS. Still Bayesian: without justification, the choice appears questionable. I think one exists. I hope. But the uncertainty exists and must be taken into account.
Three: the status of the discharge. “Zero discharge in typical conditions” means discharge in wet conditions, which come back every year. Let’s be honest, discharging the treated surplus in the rainy season under the tropics is a practice maybe not routine, but at least accepted. The existence of the discharge is relatively normal. But the PFS gives neither the limits nor the seasonal capacity of the discharge. For the cyanide-bearing water, we get just one adjective, “acceptable”, zero numbers. The word outorga (the Brazilian water permit that encompasses withdrawal + discharge) literally appears nowhere in 469 pages, and the section that promises “Water Rights” in its title says not one word of it. We will come back to it.
5.5.3 The first wet season
I can seem to be nitpicking, and I am probably even nitpicking right now. But I have seen, and myself lost, too much money in a mining thesis for not having nitpicked enough. The devil isn’t in the details. The devil is the details.
Here is an example where nitpicking would have been necessary. In July 2012, Ghana’s EPA stopped the Tarkwa heap leach (about 1/4 of the site’s production), belonging to Gold Fields, on a problem of conductivity of the discharged water linked to salinity (a routine parameter). The stop lasted three and a half weeks, or about 15,000 ounces lost, and the lasting fix, reverse-osmosis stations, cost tens of millions of $. We are talking about a world-class mine managed by a major operator with metallurgy that worked, and production stopped on the decision of an agency. If we transpose into Cabral’s context, the scenario “the heap works but the water management jams” is for me one of the most underrated in the whole case.
And it’s not over, the rain also hurts the upstream side. The ore arrives from the pit with up to 20% stated moisture (the tests measure in reality 22.1%). If it is wetter, the screening can slip, the agglomeration too (the QP flags it himself). Now, the drum has almost no water margin before making mud instead of the expected granules. We have already seen numerous precedents in the region, and Cabral doesn’t have the option, like others, of switching to dry grinding.
To be entirely fair, the “it just works out” option exists. Sansu, in Ghana, held 2.5 m of annual rain with 60,000 m³ of ponds for 3,000 t/d. Cabral, at 2,740 t/d, has comparable storage, bigger even. But, and I insist on this but, Sansu watered with sprinklers, with the evaporation valve running. Cabral stacks the same storage, certainly, but without this valve.
Hence my timing conclusion: the real commissioning test of this plant will be the first wet season in operation, or December 2026-April 2027. First pour will only be a dress rehearsal.
5.6 The samples vs reality
We’re nearly at the end of the audit, I promise. But one ultimate qualitative judgment remains for us to make: the sample itself. Ten samples, six of them 2024 composites (averaged over MG and Central) + four 2025 composites (Machichie). For 6.2 years of plan. It’s clearly limited and even the PFS documents these limits:
Part of the 2024 drilling fell outside the optimized pit. So that’s tested ore that will never be mined. Great.
The Machichie samples were taken at surface (for lack of available drill core), crushed much finer than the plant will, and tested in columns of 2.3 m of ore, vs 5 m in reality. So literally three gaps that improve the test conditions relative to reality.
The QP duly noted these gaps and recommended filling them by... simulating reality more faithfully (enjoy the pleonasm): a large column representative of year 1’s ore with variability tests to fill the uncertainty. As he writes: “a small number of tests… can result in a lower accuracy of production estimates”. These tests have, to my knowledge, not yet been done by management. And while we inventory what the PFS puts at its own charge, two caveats I hadn’t passed on yet: the high-grade veins of Machichie excluded from the test columns where the “design recoveries may not be achieved”, and the cement dosage calibrated “based on a limited number of tests”.
Speaking of the QPs, a few details worth the detour. The metallurgy QP (Raponi, Ausenco, 40 years in the business) has never visited the site: his interpretation rests on the laboratory reports and the geological model. The geotechnical QP (Elfen), for his part, spent two days there, with Pierina and Lagunas Norte on the pedigree (roughly, heaps in difficult climate). KCA is the world reference of the discipline, and a vendor with the decency to grade its own predictions. Points to weigh for attributing a degree of confidence to all these percentages.
5.7 Mercury, courtesy of the Tapajós
The ore carries mercury, up to 1.8 g/t on the tested samples. In another province, it would almost be an appendix line, but in this region, garimpo mercury is THE environmental issue of the region.
The plan treats it seriously. The mercury follows the gold all along the circuit, up to the ADR plant, and the PFS imposes capture and abatement equipment there. It’s already budgeted and without major metallurgical impact.
5.8 The engineer’s verdict, and what it costs in ounces
Let’s summarize all that.
The ore is of the right class: saprolite is the most predictable heap-leach ore there is, relatively sparing in cyanide. The process is well known: Ity (Côte d’Ivoire) leached cement-agglomerated saprolite for decades for more than 1.2 Moz and Yatela (Mali) ran the same drum-conveyor process for a dozen years.
The execution in this context is relatively new: this ore in this type of climate with this team.
The design is honest and adapted to the main variables: the 5 m lift in on/off is the right answer to tests that ruled out anything better, and the 85.4% already integrates Central’s true number.
The flaws are localized and known (at least in this deep dive):
an agglomeration without margin for error;
a cement probably under-provisioned in the budget;
a clay mineralogy withheld, at least from shareholders;
water management treated in an appendix, with choices I judge shaky without more information;
a year 1 tested on almost nothing.
My technical bear case. A recovery that settles at 78-82% (full lab-to-field haircut on MG + Central under its 72.5% via slow veins), a cement at 18-20 kg/t. Cost: about 6% fewer ounces, about US$70/oz more AISC. If I enter that into the inputs of the mine model: US$10-25M less NPV at US$2,500 gold, only about 12% at US$4,000.
To summarize: the metallurgical bear is a margin risk at the current gold price. For it to break something, it would have to be combined with collapsed gold AND capped throughput. I see it as the uncomfortable variable in the case, very probably badly understood by the market, but which has the advantage of having a big cushion underneath: the per-ounce margin.
What would make me change my opinion, quarter by quarter, in one direction or the other:
the clay reports (XRD/CEC) published (or not);
the big year 1 column, at design ratio and cycle (not likely);
the reconciled recovery by source pit: MG first but above all Central;
the pregnant solution flow at the foot of the heap (roughly the pulse of the percolation). The design promises 242 m³/h, and any plugging will read there first;
the cement tonnage against budget (5.3);
and the behavior of the site between December 2026 and April 2027.
A clean wet season, even with a somewhat higher cement cost, and this section becomes a paragraph in the next report. A failed wet season, and it’s the thesis that changes shape. For that, see you in April 2027.
6. Phase 2: the exploration, and the district thesis
I described the cash machine in Part 4, we are finally going to get to what it is supposed to feed.
My work here: transform “50 targets and spectacular holes” (the pitch) into a tiered inventory with probabilities and expiration dates (an analysis).
Let’s have some fun.
6.1 A little vocabulary just in case
Small reminder:
Inferred = mapped hypothesis < Indicated = measured to within 50 m < Measured.
Reserve = Measured + Indicated that survives the modifying factors (dilution, recovery, costs, price) in a committed mine plan.
Proven derives from Measured, Probable from Indicated.
Cabral = 128,903 oz at the most demanding rung (100% probable) + about 1.2 Moz at the resource rung. The market pays about $1,970 an ounce for the probables and about $212 an ounce for resources (reconstructed in 10.2). I am going to spend this section debating the denominator.
Small subtlety, (too) often decisive: a resource is a function of price before it’s physical inventory.
Raise the gold price in the pit shell (the pit envelope that defines what is mineable) and three things happen without a meter of drilling:
the cut-off drops (tonnes already drilled become ore)
the optimized pit widens/deepens,
marginal zones can be connected (it becomes economically viable to do it).
That translates into more resources mined at economic margins, resources that were going to be mined but that get mined for cheaper, or operational simplifications that let you mine faster. If it’s not clear, examples will clarify.
6.2 The official inventory: 1,197,800 ounces, of which 75% counted at a price from four years ago
The resource of record, per the latest AIF (the Canadian equivalent of the 10-K): 670.5 koz Indicated (26.05 Mt @ 0.80) plus 527.3 koz Inferred (20.16 Mt @ 0.81), about 1,197.8 koz.
Broken out by type:
the oxide: 287-292 koz depending on the document you open (the gap, about 5 koz, comes from two cuts of the Machichie shell), supposedly fresh from 2024-2025;
the hard rock: about 905.5 koz (450.3 Ind + 455.2 Inf, of which 157.6 koz in an underground scenario, too deep for a pit, all of it going to Inferred), estimated... in 2022, with a pit shell at $1,800 an ounce. The Inferred accounts for about 44% of the total resource (and about 50% of the Phase 2 hard rock alone).
These 905 koz of hard rock were therefore counted at less than half of the current spot, before 35,000-40,000 m of drilling, and before four post-2022 discoveries (Machichie Main, Machichie NE, PDM primary, Jerimum Cima). That leaves a lot of room to raise this number. Nothing like Cabral’s own past to show it.
Between 2018 and 2022, a rise in the gold price lowered the cut-off from 0.35 to 0.26 g/t. Add the re-modeling from the purge (3.7), and the Indicated jumped 253%. Without a new deposit.
Re-cutting the 905 koz with a shell at $3,500-4,000 is mechanically the least complicated gain in the whole case: all it takes is the existing data, a good computer and a competent geologist (and/or a very good AI). The real question is the magnitude of these gains. We will come back to it later. For now, we just shouldn’t kid ourselves: these ounces are often leaner and deeper than the ones from new drilling. Okay, it inflates the denominator. But it also dilutes their quality in part. And a potential acquirer knows that.
The elephant in the room is the timing: this inventory is stitched together from three reports at different dates (primary July 2022, MG/PDM oxide October 2024, Central/Machichie oxide July 2025). The EV/oz calculated on it mixes ounces counted at three different gold prices. It’s a fairly messy valuation, but it’s the only one we have for now.
6.3 The pending update that can change everything
The company promised a global resource update “later this year” (May-June 2026 releases, so H2 2026).
On the menu:
6-7 modeled deposits versus five in 2022, a “healthy jump” according to Carter,
maiden resources targeted for Jerimum Cima, Machichie Main primary, Machichie NE and the PDM primary (the Mutum zone of 3.4.2),
a redo of MG and Central,
and a first possible move of MG into Measured after the infill (166 holes and 5,767 m, 41 results still pending to this day).
Two observations of discipline.
One: the “MG to Measured” upgrade was promised “by the end of this month” in the May 26 release, then in the June 11 one. Still “in preparation” in July. That’s two deadline slips in two months. Nothing serious for a developer, but the metronome of scheduling promises has to be read with that in mind.
Two: any growth number written before this update, including mine below, will expire in Q4 2026. It’s the big short-term catalyst. It can completely invalidate my scenarios, upward or downward. Given the time I spent on this deep dive, they had better be... no, nothing.
6.4 The drilling machine, and how to read its results
Capacity, first. Six rigs in June 2026 (an interview number; the releases only confirm four rigs), five already on site at last check. Four are diamond rigs: they bring up an intact core of rock and offer reference samples that allow better estimates. The two others are RC (reverse circulation): they grind the rock and bring up chips. It’s faster, it’s cheaper, but no core. The construction and exploration teams are kept separate, so building the mine did not slow the drilling. Two details only come out of the interviews: the two RC rigs would belong to Cabral (no contractor to pay by the meter), and the second-half target would be 25,000-30,000 m.
The results now, and above all how to read them. It’s an art to handle with care. Here are four rules for doing it.
Rule 1: the value of an intercept (the mineralized slice a hole cuts) is the gram-meter = thickness x grade. Cabral publishes its own internal ranking, which simplifies the calibration. A rough rule of thumb: under 30 g·m, it’s noise. Above 100, serious. Above 250, it’s exceptional:
The best hole of the district, DDH372, makes 9.5 m @ 87.4 g/t (of which 2.9 m @ 285.5), about 830 g·m.
The fifth, DDH384, makes 107.6 m @ 2.5, or 269 g·m.
The fourteenth is an old friend: RC737, the star hole of the start-up (4.3), 25 m @ 7.47 from surface, about 187 g·m.
Rule 2: the true width. Each Cabral drilling release carries the warning “True widths may be up to 50% of actual drill intercepts”. Translation: the drill cuts the zones at an angle and therefore measures longer than the real thickness (it’s simply trigonometry). The 9.5 m @ 87.4 therefore makes, at best, 4 to 5 m of true width. And the 107.6 m of DDH384 is a length pierced at 60° in subvertical zones: the 107-meter layer does not really exist.
Rule 3: a hole is not a resource. To count ounces, you must prove that the mineralization continues between the holes. Remember, holes spaced 50 m at most for Indicated, and an extrapolation at most 100 m for Inferred. An isolated intercept, even at 830 g·m, is therefore worth zero ounces until it’s surrounded by dozens of holes. And it’s better that way. A lot of value has been destroyed in exceptional holes surrounded by waste. Take Jerimum Cima, management says so itself: “not currently part of the existing resource base”. To try to transform that into resource, management bet on the analogy holding with MG, where the rich veins follow each other over 700-800 m. It’s an argument for deciding where to drill. But it’s the drilling results that will have the last word. They always have it.
Rule 4: a grade without context means nothing. 25 m @ 0.7 g/t from surface in saprolite, that’s 17.5 g·m and 2027 cash. A shovel will do and the plant is already paid for. 10 m @ 8.7 in hard rock at 100 m depth, that’s 87 g·m (5x more) and yet it’s only an argument for the future Phase 2 plant with the $300-500M of CapEx Carter floated in an interview (nothing concrete) for production in 2029 at the earliest. That’s two more years of discounting and all the uncertainty that comes with it.
6.5 The pipeline, tier by tier
On to the complete inventory. I classified it from the closest to the furthest from the “bank” according to my own judgment, as always when we talk probability. I base myself above all on analogies with the deposits already modeled. My end-of-section scenarios rest on these assumptions.
6.5.1 Tier A, the defined resource
1,197.8 koz. 100% probability, it’s already in the bank. Remember that the freshness isn’t uniform (oxide 2024-25 vs primary 2022).
6.5.2 Tier B, the deposits already modeled
This is low-risk growth. Two mechanisms drive this growth.
The infill first: drilling between the existing holes tightens the grid, and ounces already counted in a low category move up a rung (from Inferred toward Indicated, even a first possible Measured at MG). That creates few new ounces, sure, but no matter. The goal is to make the existing resources more bankable.
Second method, the step-outs: drilling where the 2022 model stopped for lack of holes while the bodies remained open. Here the goal is clearly to add new ounces, but following a model that already exists and that raises the probabilities of success. MG finished its infill (the 166 RC holes of 6.3) and Central, 21.5 Mt @ 0.88 (Indicated + Inferred, for a total of about 608 koz), is well known. Hence my high probability of 70-85%: you drill where you already know the gold probably is. I put the gross incremental content at 80-150 koz (8 to 14% of MG+Central). I could be a little more optimistic, but optimism rarely rewards mining shareholders.
One variable remains, maybe some of you are waiting for it: the gold price. We explained that a rising gold price allows transforming waste into viable ore. Is that the case here? First, it mostly applies to the 905 koz of primary. But enormous uncertainty still remains above all, and the distribution probably has a fat tail toward 0. I do not know if it’s an all-or-nothing, but the nothing is not negligible. So I count 0 additional ounces for this variable. I see it as a free lottery ticket.
6.5.3 Tier C, the targets drilled without resource
The main source of the potential 2026 re-rating.
Here all the published holes prove there is gold, but none proves a continuity. The 2026 update will be the judge target by target: either the framing holes connected the hits and resources get added, or they didn’t and on to the next. Hence the coin flip: 40-60% depending on the target.
Here the concerned deposits are (in decreasing order of potential): Jerimum Cima, Machichie Main, Machichie NE and Mutum (the PDM primary). I spare you a new description of the deposits, but here is the summary visual just in case (plus it bumps up my ROI on the time spent making them, win-win).
Gross content: 150-300 koz for Jerimum Cima. My reasoning is that MG (the flagship) already carries about 460 koz of total resource for a 700-800 m system (6.4); Jerimum Cima already outlines a 900 m system. Adding 150-300 koz is betting it will be worth between 1/3 and 2/3 of an MG at equal size. Here too no heroic hypothesis, just one more deposit in the district average with a conservative haircut.
Following this logic, I take 80-180 koz for the rest of the tier (0 for Mutum which has only one hole, let’s not get carried away).
6.5.4 Tier D, the undrilled
Here we enter pure optionality, the one that makes this bet attractive in my eyes, and where the future district scenario can live.
Forget the holes. Here we do pure prospective geology. We’re two rungs below anything concrete, but the clues are serious. More than 50 targets on a 10x15 km district, while the deposits currently modeled fit within a core of a few kilometers.
Remember also the gold-in-soil anomaly of about 7 km, against about 1 km at Tocantinzinho before its discovery. And about ten boulder fields (2.2, blocks that erosion tore from a vein never found), gathered at surface and assayed, with averages that stop you cold: Alonso, 91.7 g/t over 23 blocks along 950 m, more than the best hole of the district; Tracajá 74.9; Medusa 24.7; isolated samples up to 3,727 g/t, 5,700x the grade of the reserves.
I insist, nothing is less sure. These blocks only give an indication of where to look, no more, no less. The drone-mag, the targeting machine of 3.2, sorts the pile, AI-assisted, over about 20 km².
And so, what is the probability that a prioritized target becomes a deposit one day, and what is the quality of this potential deposit? I have no idea. What is the probability that several deposits get found and make the district thesis true with millions of oz? I have strictly no idea. The situation is much too complex.
I know neither the probability of finding a deposit, nor the potential value of this deposit. I can’t even ballpark the distribution of probabilities. To resolve the district thesis, I would have to calculate these probabilities and the values associated with these potential deposits for each of the potential targets, and calculate the expected value. Impossible. Even ballparking it, impossible. So I had to find a workaround, but more on that later.
6.6 The track record, and the ROIC of the drill
Two questions remain for me to answer on the drill: has it already proven that it transforms meters into ounces, and is the dollar spent well used?
On the first, the verifiable history is fairly limited. 171 koz Indicated in 2018. 604 koz Indicated in 2022 (1,138.5 with the Inferred), but most of it comes above all from the model purge (3.7). It’s more an accounting correction than an effective drill.
Four years later we’re up 59 koz in total (6.2), the Indicated having gained 66 koz and the Inferred given back 7, while four named discoveries piled up off balance sheet. Thin, but the context explains it. The pedigree of the man himself is excellent: five discoveries from scratch, including Tocantinzinho. The end-2026 update will be Cabral’s first real test. The drill drilled, the dollars were spent, the results published hole by hole. The question that remains: how many ounces will be counted.
On the second, we can at least quantify. C$1.93M (drilling 1.74M + assays 0.19M) for 10,087 m in the last half, or C$192/m. The 35-40,000 m drilled since 2022 therefore cost about US$5M direct (at the 0.71 exchange rate), say US$9-13M once loaded with the rest (geologists, camp, geophysics, which I round generously). What all these drilled meters buy is a range of 310-630 gross koz (sum of tiers B and C). On this base, the prospective creation cost falls in the model’s range, about US$16-30/oz.
An ounce the market pays about US$212 for at Cabral (6.2). In recent Brazilian M&A, once normalized to the current gold price, we are in a similar range: $200-260 (I detail in 10.5). One dollar in the drill = $7 to $13. And I remind you that I was conservative in my estimates and that I stripped the district angle out of the base. Cut it in half and we’re at a 3x at least. Weight by my 6.5 probabilities and we’re still at 2x to 10x. Suppose even that I have it all wrong and that Cabral drills at the industry’s average cost (about US$62 an ounce according to MinEx, 2009-2018), it still comes out to nearly 3.4x. Any way you cut it, the drill pays for itself.
Obviously, this is only prospective and the update will be the moment that sets the denominator. What’s more, the numerator varies (Cabral’s market cap). Nothing is fixed. But the trend is clear. Drilling is by far the best use of Phase 1’s cash, and it’s precisely Phase 2 of the plan. And about time.
6.7 The Phase 2 PEA: the second Lassonde cycle
How much is Phase 2 worth? Zero NPV in this write-up.
Management’s calendar:
resource update end 2026,
then PEA in Q2 2027 (the first economic study of the hard rock).
A PEA (Preliminary Economic Assessment) is the rung under the PFS in the ladder of studies: a relatively conceptual mine plan, a ballpark CapEx, an NPV just as ballpark, and above all the right to count the Inferred (a right the PFS doesn’t have).
To summarize, the update recounts the warehouse, and the PEA is the first quote (in pencil) for the plant that would empty it. Then a PFS end 2027, a construction decision “probably in 2028” and a mine for 2028-29.
The orders of magnitude (careful, all these numbers come only from interviews): 150-250 koz per year, of the same caliber as Tocantinzinho, 7-10x Phase 1, a CapEx “3, 4, 500 million… may be more”, also x10 Phase 1.
One hard piece of data already exists: hard-rock recoveries tested at 90-97% in the lab (the gravity and the CIL tanks of 3.3.4). Two facts put this in a little context. One fact: the LP of March 10, 2026 covers the complete project (”1 million tonnes/year, and beyond”, says the release). Concretely, the five-year permit wall is behind for both phases. Only the LI then the LO remain, and they’re shorter. Two: the financing, estimated at US$300-500M, will be a 2028 problem (still according to management’s forecasts), and backed by Phase 1’s cash flow (and by the re-rating that may have happened by then).
Hence the refusal. To give an NPV to Phase 2 today, you would have to build the plant in a spreadsheet: take the interview numbers above, draw cash flows from them, then multiply the whole thing by a probability of success. The industry calls that an rNPV. Right now, I call that science fiction: invented assumptions, multiplied by an imaginary probability. Your time and mine are too precious for that.
I chose something more modest. I value the hard-rock ounces like inventory, at a per-ounce price that reflects the degree of confidence:
$80-150 the Indicated,
$30-70 the Inferred.
It’s 2-4x under the $200 that the market pays for ounces of this type on average, but it’s necessary. The oxide starter carries its value in DCF because it arrives in a few months. The 2027 PEA will transform this denominator into an NPV question, for potential revenue in 2028 at the earliest. With the discounting that comes with it. Hence my significant haircut.
I’ll note all the same that the PEA will change the nature of these objects. They will have earned the right to belong to the NAV (if there are ounces, obviously), with all the Lassonde-curve arguments that come with it (discovery euphoria, development trough, re-rating on the approach to production).
6.8 So, what growth is probable?
It’s time to assemble all these hypotheses.
The bear: 1.20 Moz.
Nothing new on the board. 0 additional conversion, all this work led to nothing more. The advantage of this scenario is that it depends (almost) not at all on the future. The dream.
The base: 1.50 Moz.
1,198 koz in the bank + 90-115 koz of infill and step-outs (weighted range of tier B: 56-128) + 120-150 koz at Jerimum Cima (weighted: 60-180) + 55-80 koz on Machichie Main, Machichie NE (weighted: 32-108).
A quick note: at the base, the model splits the new oz into 40% oxide and 60% hard rock (the oxide share drops when the increment rises). As a reminder, the 40% have a plant nearly paid for and ready in a few months. The 60% hard rock will go on to fatten the PEA.
The bull: 2.00 Moz.
Tiers B and C converted almost in full (about 470 of the 630 gross koz), plus roughly the rest coming from the first successes of tier D. Why 2M? Simply because it’s management’s target and the number they keep repeating.
And here I need to add an extremely important caveat that will deeply shape all the rest of this deep dive, including, even above all, the valuation and my own strategy.
That’s it for free subscribers.
Marketing 101 would have me tease what’s below, play on your frustration, all that. I’m too tired for that. I should have published hours ago. A corrupted file decided otherwise.
You already know what’s down there: the remaining 40% of the deep dive, same caliber as what you’ve read so far.
For those interested: I publish 20+ deep dives like this a year, with regular follow-ups, up-to-date valuation models, and a lot more. Go have a look. A lot of you have already joined, and I know from experience most people are convinced long before they get here.
If you’re on the fence, or just have a burning urge to read to the end without paying: one free article. Order from the house.
