
Atlas Salt: The Best Risk/Reward Setup I’ve Seen in My Career
500+ hours of work condensed into 40,000 words, for free.
I do not write that lightly.
At first glance, the company is easy to dismiss. It operates in a corner of the economy most investors do not even know exists, with no close publicly listed peer, and almost no natural public-market investor base.
The fact that the project exists at all is unusual: North America has not seen a comparable new entrant emerge in a generation. In this market, a company needs a rare combination of scale, cost advantage, logistics, customer relevance, and timing before it can even matter. This company has all of them.
Disclosure: I have skin in the game. I’ve been a shareholder for months, and I bought more during the writing of this investment thesis. That creates an obvious bias. The only honest way to handle it is to make the machinery visible: every assumption, every number, every calculation, and every place where the conclusion could be wrong. Do not take my word for it. Check the work. Then check it again.
The aim of this piece is to make the entire chain explicit: the upside, the downside, the assumptions, and the asymmetry between them. I spent over 500 hours on this thesis, condensed into 40,000 words, because the full answer emerges when you grasp the whole picture.
That level of work is deliberate. I spend 90 hours a week analyzing businesses, writing, reading filings, rebuilding models. This newsletter is where I publish the work, and I want it held to the same standard.
If this is the kind of work you want more of, join the list.
The valuation section includes the full DCF, with every figure and assumption made explicit.
There is a second thesis tied to this one: a different way to own the exact same setup. It rests entirely on the work below, so read this first. I save it for the end.
Table of Contents
01. An Overview of the Company
02. The Salt Market
The $26 Billion Picture
Not All Salt Is Created Equal
One Molecule, Three Jobs
TINA
The Implication for an Upstream Producer
How the Market Actually Works
The Buyer Side
The Seller Side
Demand That Does Not Bend
A Supply Base Frozen Since 2001
Import Dependence, Weeks Away
Pricing Without a Market
Where the Margins Are
Climate & Environment: The Objections That Do Not Stick
Where This Leaves Us
03. Atlas Salt’s Mine: Great Atlantic Salt
The Deposit
Transport Logistics as a Moat
The Operational Design
The Social Component
Permitting
Jurisdiction and Community
Environmental Profile
04. The Business Model
The Product: One Feedstock, Several Commercial Formats
Where Atlas Plans to Sell
How It Actually Sells: CIF, DAP, FOB
The Contracts
Scotwood Industries: Commercial Offtake + Canadian JV
Sandvik Mining: Equipment + Vendor Financing
Hatch Ltd.: Lead Engineering & IPD Partner
Continental Conveyor: Material Handling + IPD Partner
05. Management and Alignment
The Operators
Patrick Laracy: The Founder Who Stayed
Rowland Howe: The Man Who Knows the Competition
Nolan Peterson: The Executor
The Construction Bench
The Cap Table
The Royalty
What Laracy’s Alignment Means for Shareholders
The Net Read
06. A Quick Look at the Financial Statements
The Wrong Place to Look for Value
Balance Sheet Snapshot
The Cash Question
The Next Step
07. Financing
What Atlas Needs to Fund
The Debt Architecture
The Cost of Financing
What to Watch
08. The NPV: Decoding the C$920M Headline
The Revenue Side
The Price
The Volume Schedule
The Escalation
The Cost Side
The Build
Sustaining Capital
Operating Cost
The Royalty and the Taxes
The Sensitivity Analysis
The Discounting Mechanics
Why 8%?
My Choice of Discount Rate
09. Risks
The Financing
The Build
The Commercial Ramp
The Salt Price
The Permitting Tail
The Port Agreement
10. Valuation
The Ratio and Its Double Reading
Qualitative Valuation
Quantitative Valuation
Financing Costs
Working Capital and Corporate Overhead
Residual Risk Reserve
Execution
Salt Price
Sales Mix
Dilution
How Much Is Atlas Salt Worth?
11. Repricing
Recognition
The Critical Gates
The Variables
The External Catalysts
Timing and Sequence
Sit-on-your-Ass
Someone Else Pays
Why M&A
When M&A
Management’s Take
Signals to Watch
12. My Final Take
13. A Better Way to Play the Setup
01. An Overview of the Company
The company is Atlas Salt Inc., listed under the ticker SALT on the TSX Venture Exchange and SALQF on the OTC market in the United States. Its market cap is around C$120 million (US$88M).
The project, Great Atlantic Salt, is a planned underground salt mine in Newfoundland and Labrador (NL), Canada, wholly owned by Atlas Salt.
If that sentence made you want to stop reading, that is exactly why I think it is so cheap.
The 2025 Updated Feasibility Study (UFS) gives Atlas a 24.25-year reserve-case mine plan:
95.0 Mt of Probable Reserves,
C$272 million of average annual pre-tax cash flow,
and a C$920 million after-tax NPV at an 8% discount rate.
That is only the reserve case. The 95 Mt sits inside a much larger resource envelope: 288 Mt of additional Indicated Resources + 868 Mt of Inferred Resources, to which the UFS assigns no value.
Atlas trades at a P/NPV of approximately 0.13x,1 about 1/2 to 1/3 of the level at which comparable feasibility-stage mine developers typically trade, even though many of them arguably carry more risk than Great Atlantic Salt.
In the last eighteen months, Atlas has rebuilt the team around construction. A new CEO was hired. The project now has tier-one names attached across the build chain: non-binding MOUs on equipment, financing support, distribution, and engineering/delivery. Early works have started on site. The project-financing process is now underway.
The stock still trades as if almost none of that progress has been priced in.
And that is before the main point of the thesis.
My conviction is that the UFS materially understates Great Atlantic’s earning power. Most of the next 40,000 words are the work behind that sentence.
The first step is the salt market itself. A large part of the story, and a large part of the mispricing, sits there.
02. The Salt Market
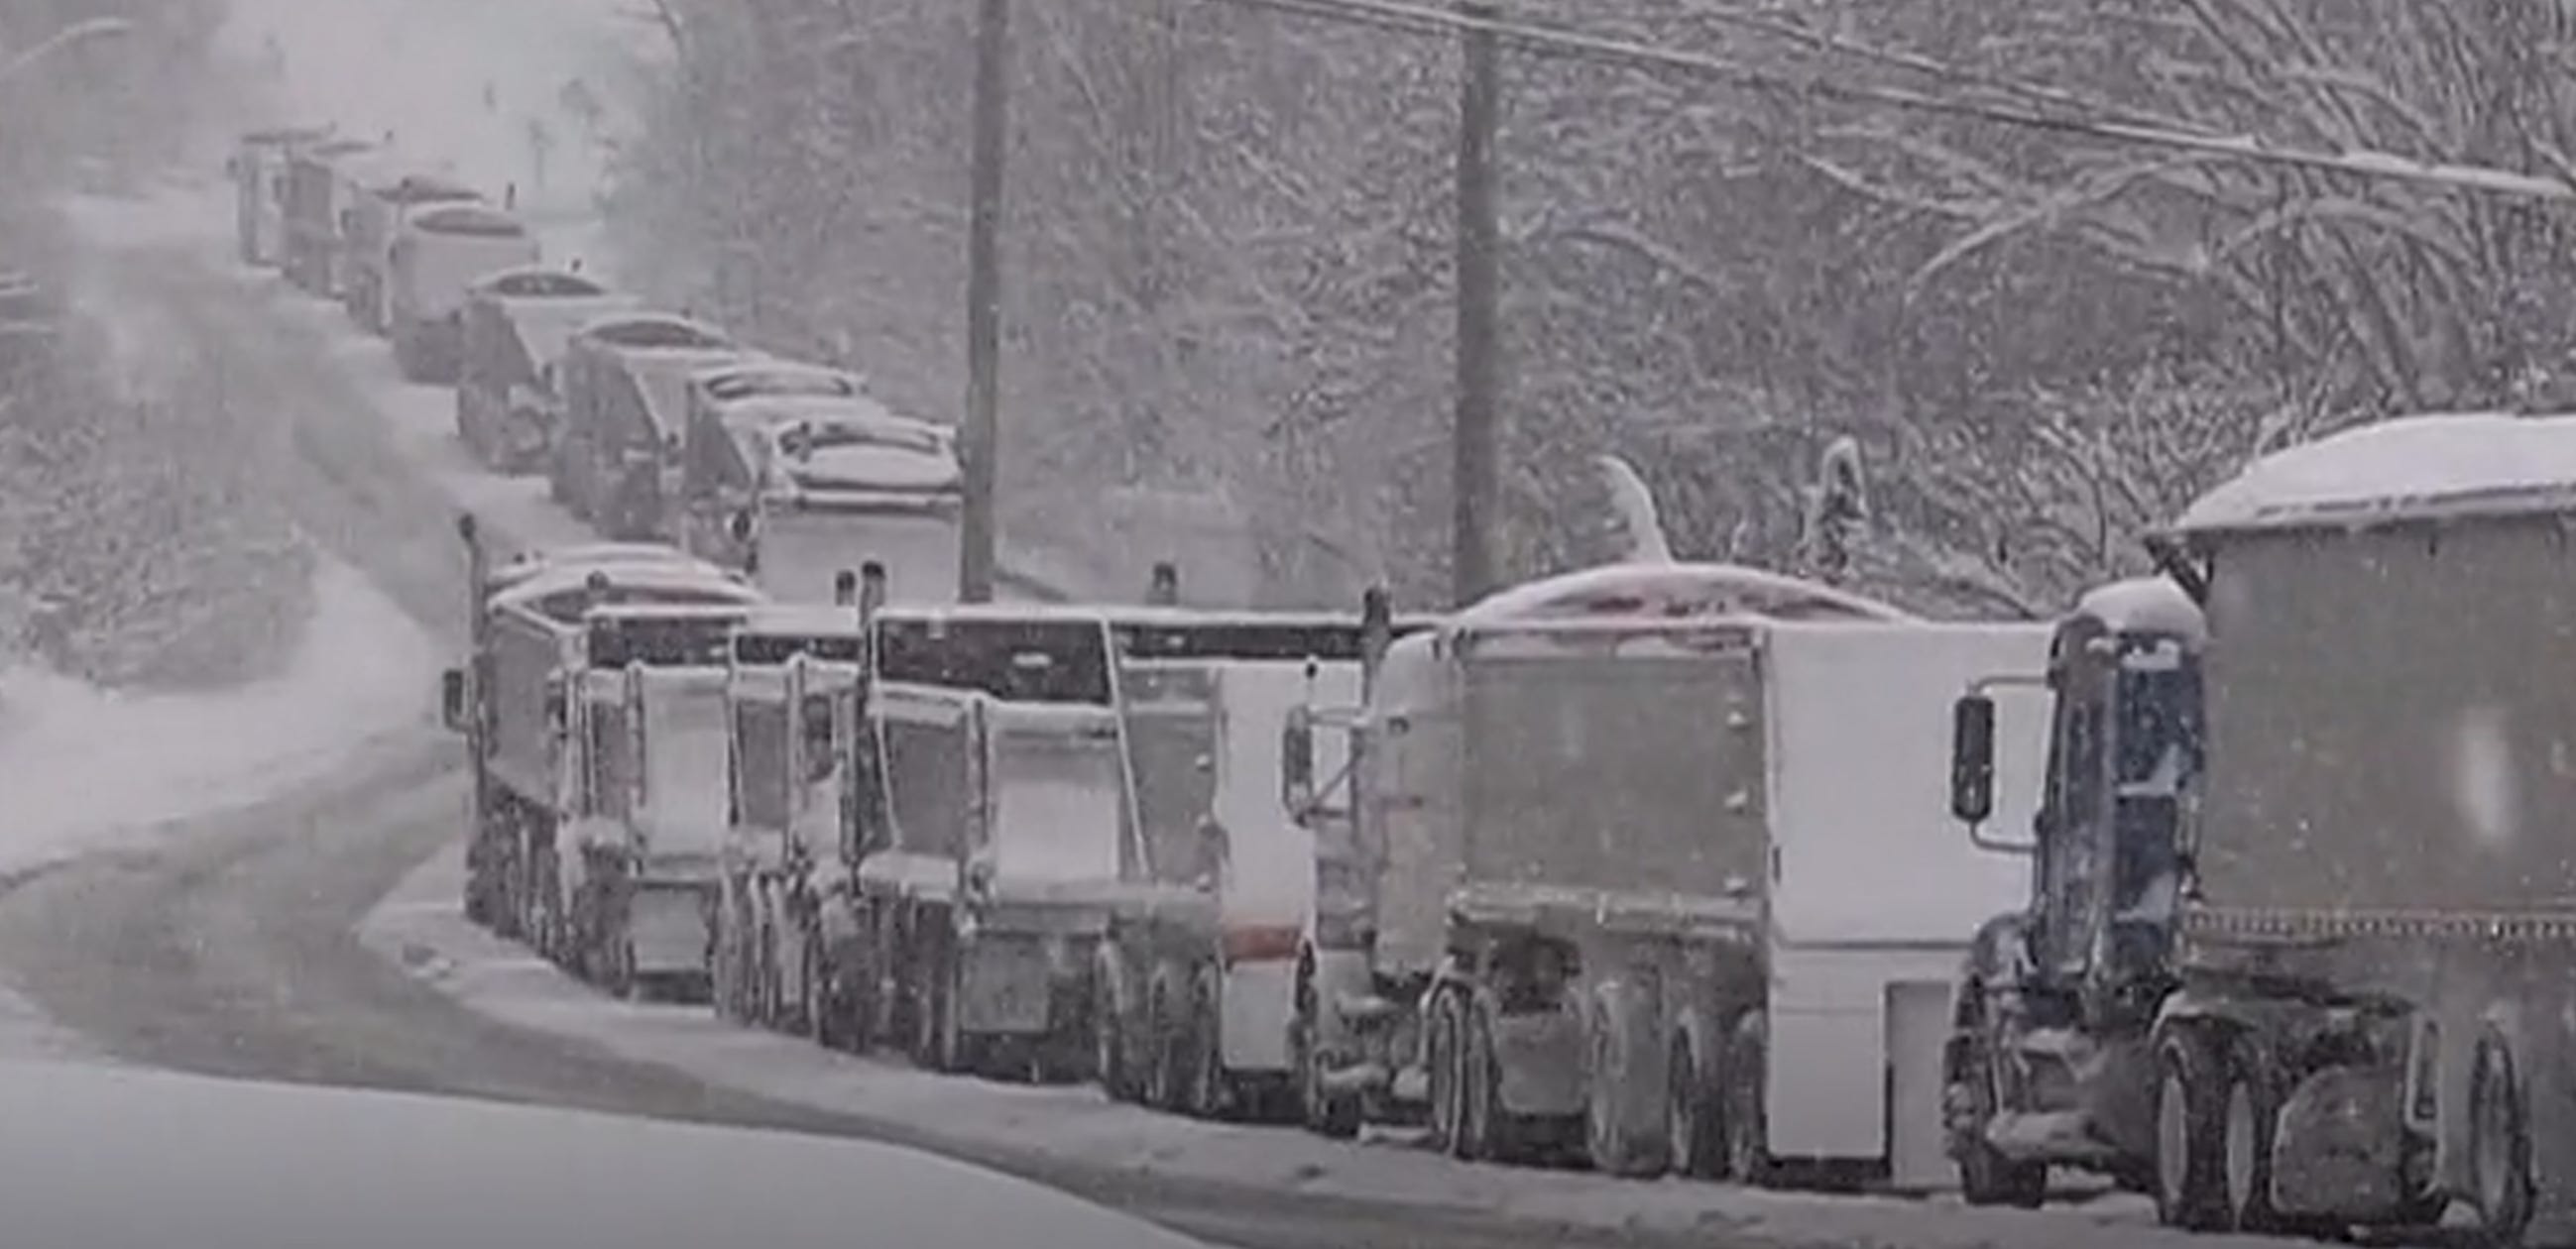
In January 2026, for the second consecutive year, parts of Ontario ran out of contracted deicing salt supply and turned to the spot market. Emergency spot prices reached nearly C$300 per tonne, more than 4x normal bulk pricing, in a matter of weeks.2
More than a hundred trucks lined up outside Goderich, the world’s largest underground salt mine, waiting for product the mine couldn’t deliver fast enough. Municipalities were rationing supply, spreading salt at just a quarter of normal rates, while private contractors scrambled for every tonne of deicing salt they could find. They were paying nearly C$300 per tonne for what little they could get. They had to. And in a hard winter, they will again.
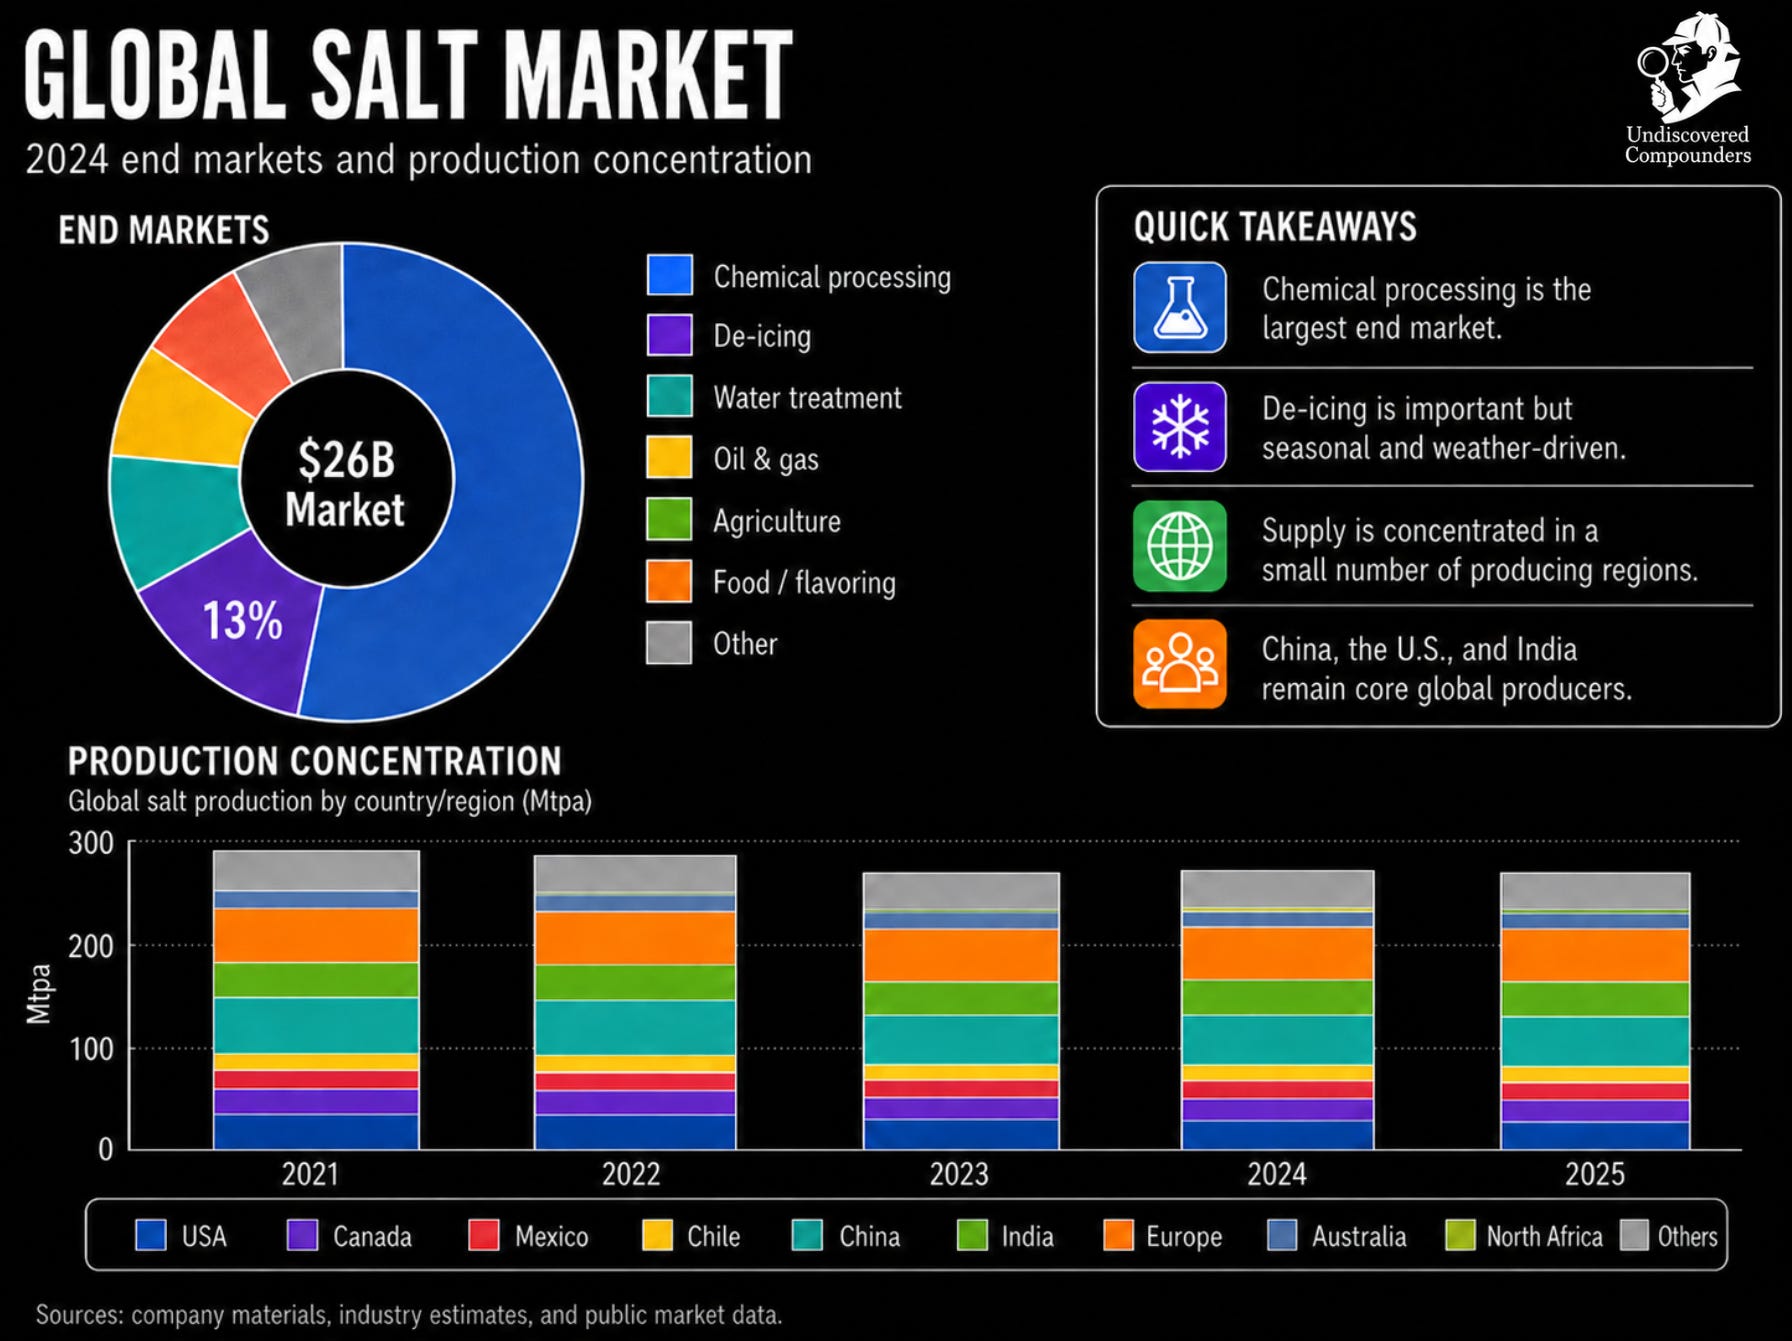
This is what an undersupplied and fragmented market looks like when winter hits. And yet, the salt market has no exchange ticker, no ETF, and no CNBC segment. A product as old as civilization, a use case nobody finds exciting, and a US$26 billion market that Wall Street can’t be bothered to cover.3 Precisely the kind of sector worth digging into.
The $26 Billion Picture
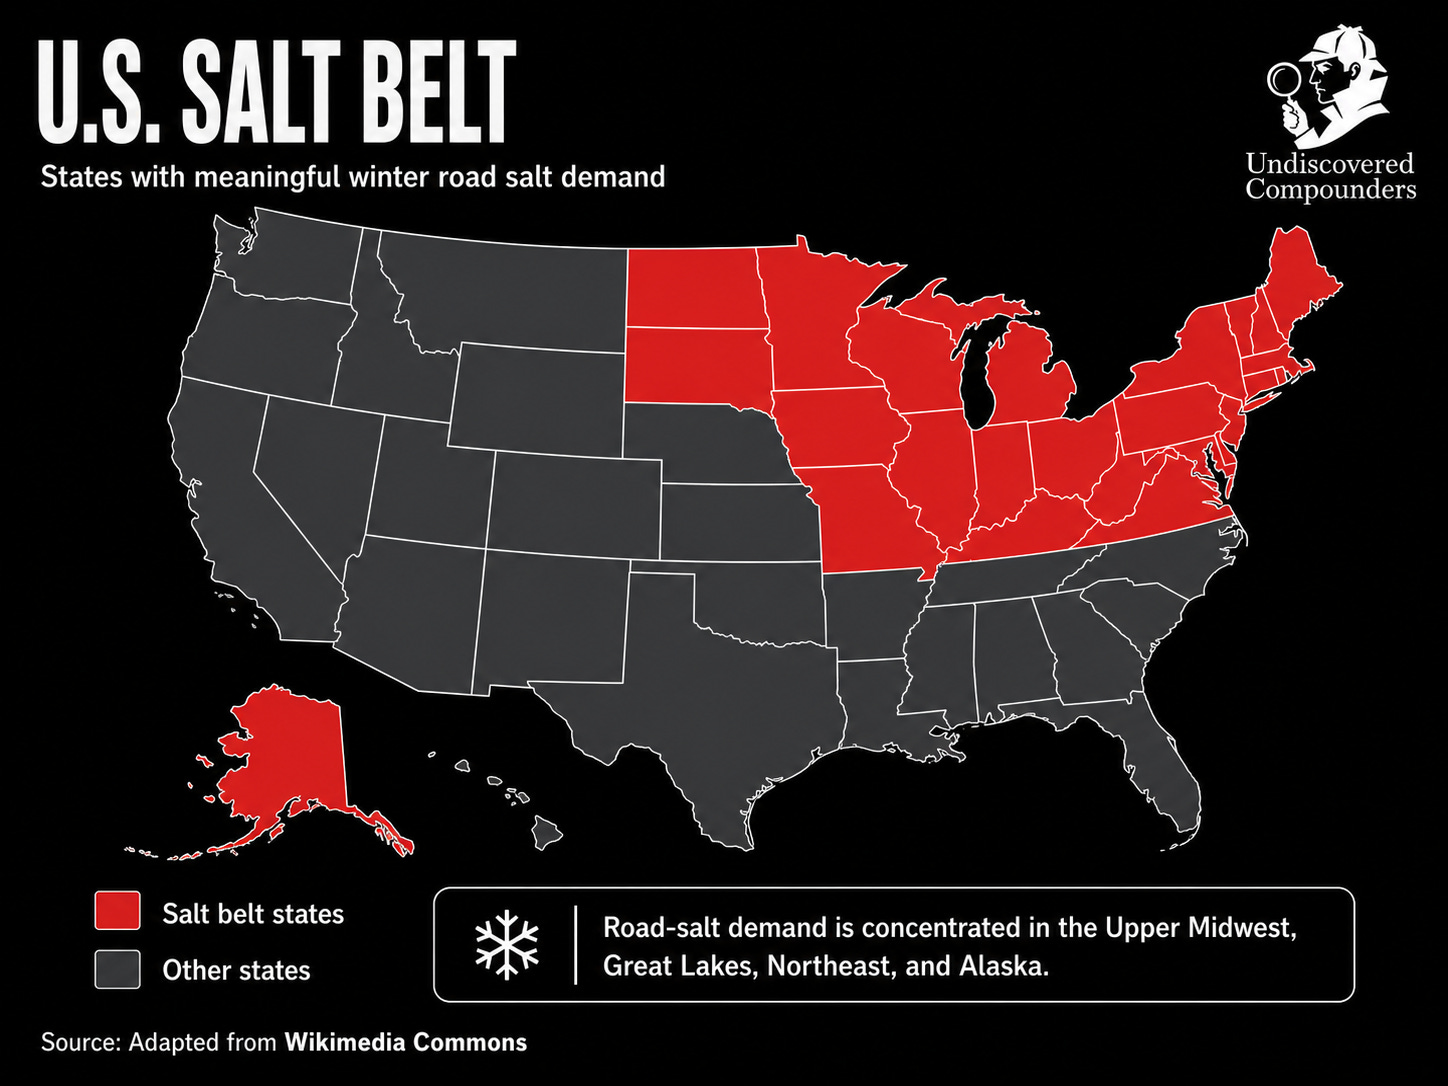
The global salt market is worth around US$26 billion, with annual production of approximately 270 million tonnes. Deicing is only about 13% of global salt demand, and even that demand is not spread evenly across the map. It sits where winter actually forces governments to act: North America and Northern Europe. Northern Europe matters, but it is approximately one-quarter the size of North America’s deicing market. So we start here.
And even North America is too broad. Road salt is not really a continent-wide market. It is a logistics market wearing a commodity label. The core sits in the East, where winter is frequent and unforgiving. For Atlas, the relevant map is therefore much smaller: eastern Canada and the U.S. East Coast.
The eastern North American deicing market consumes between 30 and 36 million tonnes of salt in any given year, depending on winter severity.4 This is, for all practical purposes, one cross-border physical market, even if it remains fragmented commercially and logistically. Canadian rock salt moves into American cities, and American production moves north into Canada.5 In plain terms, the border is broadly administrative.
The U.S. accounts for the majority of this consumption and provides by far the most granular public data. The analysis that follows relies on U.S. data because that’s where the data is, but in practice, market dynamics are similar enough on both sides of the border for the U.S. data to be useful.
In most commodity markets, a persistent supply gap attracts capital, but not in eastern North American salt. When a product can cost more to ship than to produce, every additional kilometer is a burden. That is where the economics are decided, including Atlas Salt’s future economics.
Not All Salt Is Created Equal
Walk through any Department of Transportation (DOT)6 yard in February and you’ll see the same molecule in three or four different forms. A dome of dry rock salt. Tanker trucks of clear liquid brine. A second pile, slightly damp and faintly brown, coated with magnesium chloride and an organic additive. At the spreader, an operator sprays more brine onto the dry salt as it leaves the spinner.
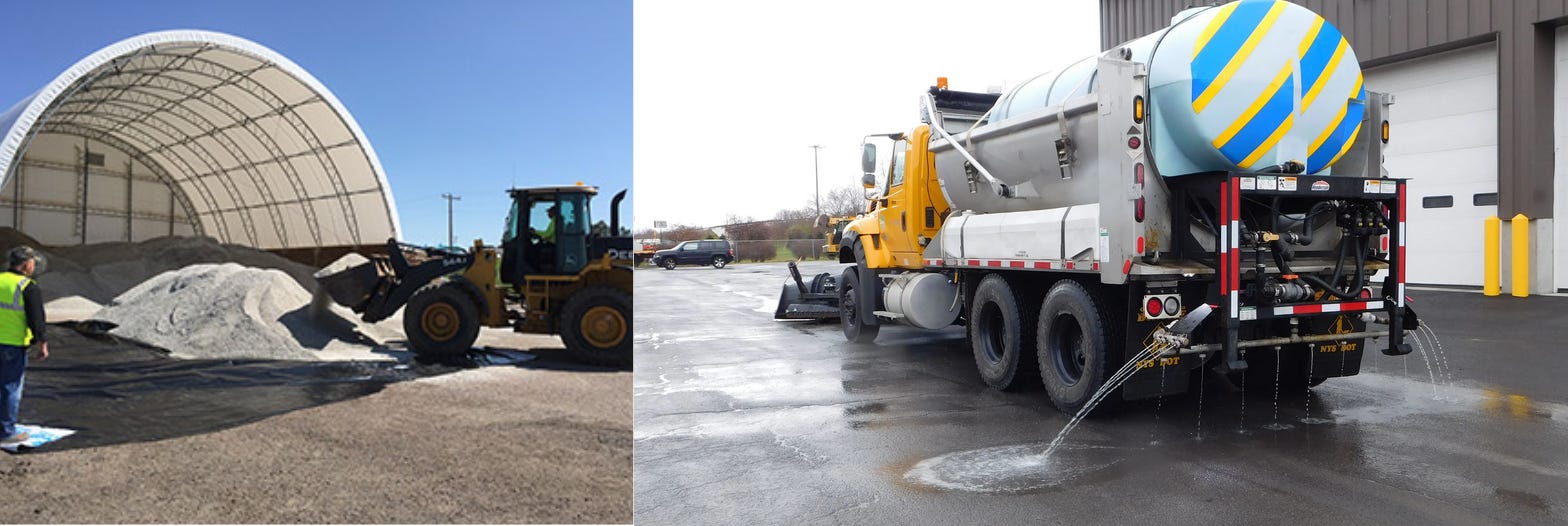
At the center of all of it is sodium chloride. The variations are delivery systems around one feedstock.
The standard taxonomy sorts salt by production method and hides the chain underneath.
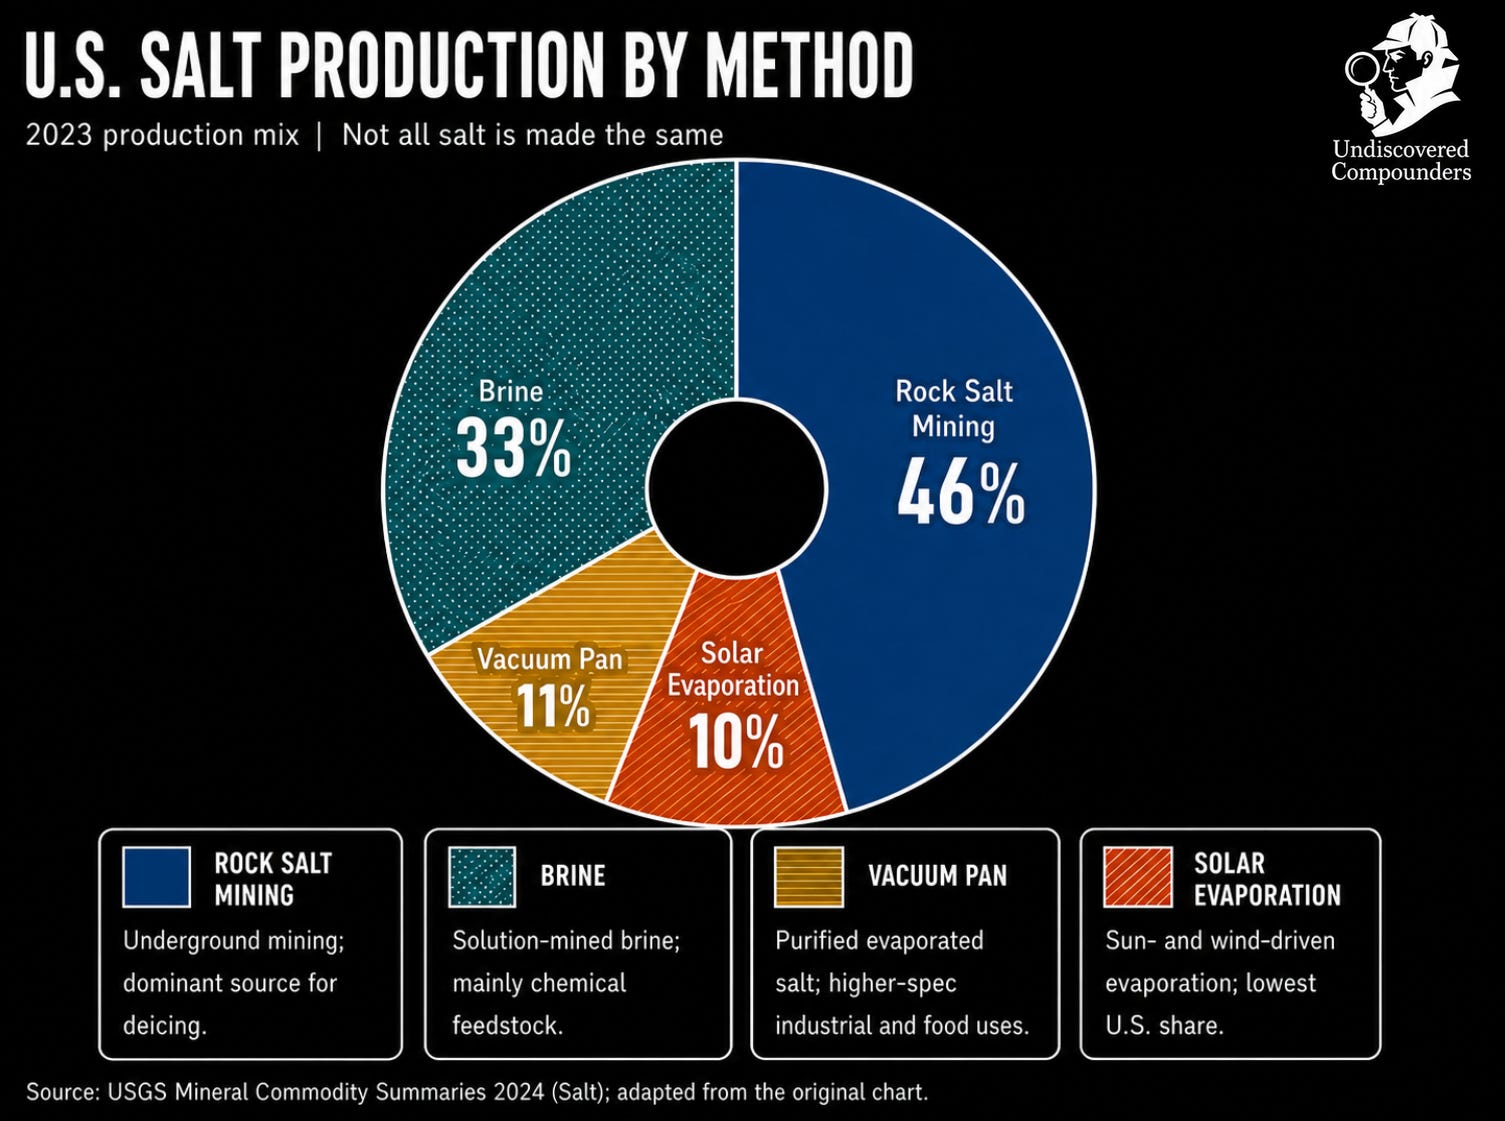
Rock salt comes straight out of a mine.
Brine is rock salt dissolved in water (in winter maintenance).
Vacuum pan salt is produced by evaporating purified brine back into crystals.
Only solar salt takes a different path: seawater or lake water evaporated by the sun in coastal ponds.
All four are sodium chloride and all four can melt ice.7 The market is still not a four-way contest. Vacuum pan salt does not belong on highways, it is too expensive for that. Its markets are food, pharma, and industrial applications. Brine reaches the road as a liquid for anti-icing and pre-wetting, and the brine DOTs spray is almost always made on-site by dissolving rock salt in water. Collapse the chain, and the deicing market has two real upstream inputs: locally mined rock salt and imported rock and solar salt from coastal evaporation ponds.8 Everything between the mine and the road is downstream chemistry around one of those two.
One Molecule, Three Jobs
Winter maintenance runs on three operations.
Anti-icing happens before snow falls or freezing rain begins. Crews spray a liquid brine onto dry pavement hours ahead of the event, typically a 23.3% NaCl solution, the eutectic concentration9 of sodium chloride in water. The brine leaves a thin salt film on the pavement and stops ice from bonding to the asphalt. When the storm arrives, plows can clear the road. Anti-icing has become standard practice across most snow-state DOTs because it prevents snow and ice from bonding to the pavement, making plowing more effective and materially reducing the amount of chemical needed versus reactive deicing alone.10
Deicing is the reactive application during and after the storm: dry or pre-wetted salt spread onto bonded snow and ice to break the bond so plows can scrape it off. This is what most people picture when they think of “salting the roads.”
Pre-wetting is the in-between move. Liquid brine is sprayed onto the dry salt at the spinner, just before it hits the pavement. Wet salt sticks to the road instead of bouncing into the ditch. It dissolves faster and starts working sooner. Agencies that use pre-wetting properly report 20% to 30% reductions in total salt usage at the same level of service.11
Less rock salt, then? Atlas is going to mine rock salt. Bad for business, right? No. Where brine is used, it is usually made on site by dissolving rock salt in water. Treated salt is rock salt coated with small amounts of chloride brine and, in some cases, organic additives. The dry salt is rock salt.
A single tonne mined in Goderich or Cayuga, or eventually in the future Atlas Salt’s Great Atlantic Salt, can leave the mine and end up on the road as dry crystals, as 23% brine, or as treated salt with a chemical coating. The downstream chemistry is the buyer’s local decision. The upstream supply is the same molecule from the same kind of mine.
TINA
Calcium chloride and magnesium chloride sometimes get called “alternatives” to road salt, which misreads what they do. Their economics, at 3 to 5 times the cost per tonne, rule them out as primary deicers. Their job is narrower: extending the working temperature range of a rock salt program.
Sodium chloride starts losing effectiveness around -10°C. Calcium chloride works down to approximately -25°C, magnesium chloride down to about -15°C. When pavement temperatures collapse, agencies do not switch to calcium chloride across the board. They spike a calcium chloride solution into their brine, or coat their rock salt with it, and get the extra temperature range without paying full alternative-chloride prices on every tonne. Most treated salt is some version of this: rock salt with a brine coating that extends its useful range by 10 to 15 degrees.
Acetates and formates are a separate category. Potassium acetate, sodium acetate, calcium magnesium acetate, and related products do not contain chloride; they are therefore generally less corrosive. That matters mainly in two places. Airports, where chloride contact with aircraft is a non-starter and deicing products must meet specific aviation standards. And a small set of bridges and parking structures where corrosion risk can justify paying 10 to 20 times the cost of rock salt.12 Everywhere else, acetates and formates remain a rounding error in volume.
Sand and abrasives are also used, but they play a different game. They do not melt anything; they provide traction on top of ice when temperatures drop below what any chemical can fix, or on rural roads where the cost-benefit math does not justify a chemical program at all. Most agencies that use sand still mix in 5% to 10% salt to keep the stockpile from freezing solid.13
I will leave the final word to the United States Geological Survey14:
“No economic substitutes or alternatives for salt exist in most applications.”
The Implication for an Upstream Producer
A rock salt mine sits upstream of the entire deicing system. Dry tonnes for direct application. Brine feedstock for anti-icing programs. Base material for treated salt and pre-wetted formulations. Almost every operation, every chemistry trick, every “smart-salting” innovation municipalities have adopted over the last two decades starts with rock salt.
Atlas sits at that input point: dry salt for direct use, feedstock for brine and treated products, and emergency tonnage when winter breaks the procurement plan. It is building a feedstock source for a system already under strain, and in hard winters, one setback away from breaking.
Let’s focus on the strain.
How the Market Actually Works
The Buyer Side
The buyers split into three tiers.
The first is government: state and provincial Departments of Transportation (DOT), counties, municipalities, the people who keep highways open or get blamed if they do not. Together they account for approximately 70 to 80% of North American deicing rock salt consumption (a national average; the split varies meaningfully by state and by density of development).15
The second tier is commercial. Professional snow management companies servicing parking lots, warehouses, hospitals, and corporate campuses under seasonal contracts, plus the facility managers of large retailers and logistics operators who buy directly. About 15% to 20% of volume.
The third is retail. Homeowners buying 10 kg bags at Home Depot, Walmart, grocery stores, and hardware stores. The remaining 5% to 10%, give or take, is an entirely different economic creature. The buyer here is the person who slipped on their own porch last February and decided never again.
The three tiers buy on completely different terms.
Government buys most of its deicing salt on the calendar. A state DOT or provincial transportation agency signs its contracts months ahead of winter, usually between May and August, for a season that won’t start until November. The salt is usually delivered in September and October, stored in the salt domes and sheds you see along the highways, and used through April. The public buyer usually does not buy from a single national supplier; it carves its territory into zones (e.g., Massachusetts has eighteen contract zones) and each zone is awarded to a single vendor for the entire season. The contract sets a volume band: the buyer commits to a minimum, usually 60-80% of estimated quantities, and the vendor commits to a maximum of 110-140%.16 Anything above that contracted band falls outside the contract economics. Once the protected tonnage is gone, buyers are competing for uncommitted supply at market prices. Call it spot, emergency supply, or panic procurement; the mechanism is the same. Ontario in January 2026 was just the mechanism in public view. Counties and municipalities buy in smaller quantities, sometimes through their own contracts, more often through pooled bids run by a state or provincial agency to capture the volume discount.17
Commercial buyers play a harder game. Their contracts are usually signed between a property owner or facility manager and a snow management contractor, not directly with a salt supplier. The pricing model determines who carries the weather risk:
In a per-push contract, the contractor gets paid each time crews service the site.
In a per-inch contract, the price rises with snowfall depth.
In time-and-materials contracts, labor, equipment hours, salt, and other materials are billed as used.
In a seasonal flat-rate contract, the customer pays one fixed fee for the winter, regardless of how often it snows.
Each model transfers weather risk differently, but all of them end in the same place: the contractor has to source the salt.18 There are approximately 22,000 commercial snow contractors in the United States.19 Most of them buy from a regional bulk distributor. That layer exists precisely because integrated producers won’t build a commercial team, a dispatch desk, and a fleet of trucks to chase 22,000 individual contractors, many of them ordering a few hundred tonnes. The math only works at public-bid scale.
Retail does not really buy; it panics (yes, I’m still talking about deicing salt). When a storm is forecast, shelves empty. Season-to-season demand is more volatile than the two bulk tiers, but the long-run floor is the same: across much of the Northeast, homeowners and property managers are expected, and often legally required, to keep sidewalks and walkways clear. A slip-and-fall claim20 turns a ten-dollar bag of salt into cheap insurance.
Everyone needs salt before the storm. But not everyone can get it on the same terms. That is why a 10 kg bag of salt can end up costing several times more per-tonne than the bulk road salt purchased by a DOT, even before a storm hits.
The Seller Side
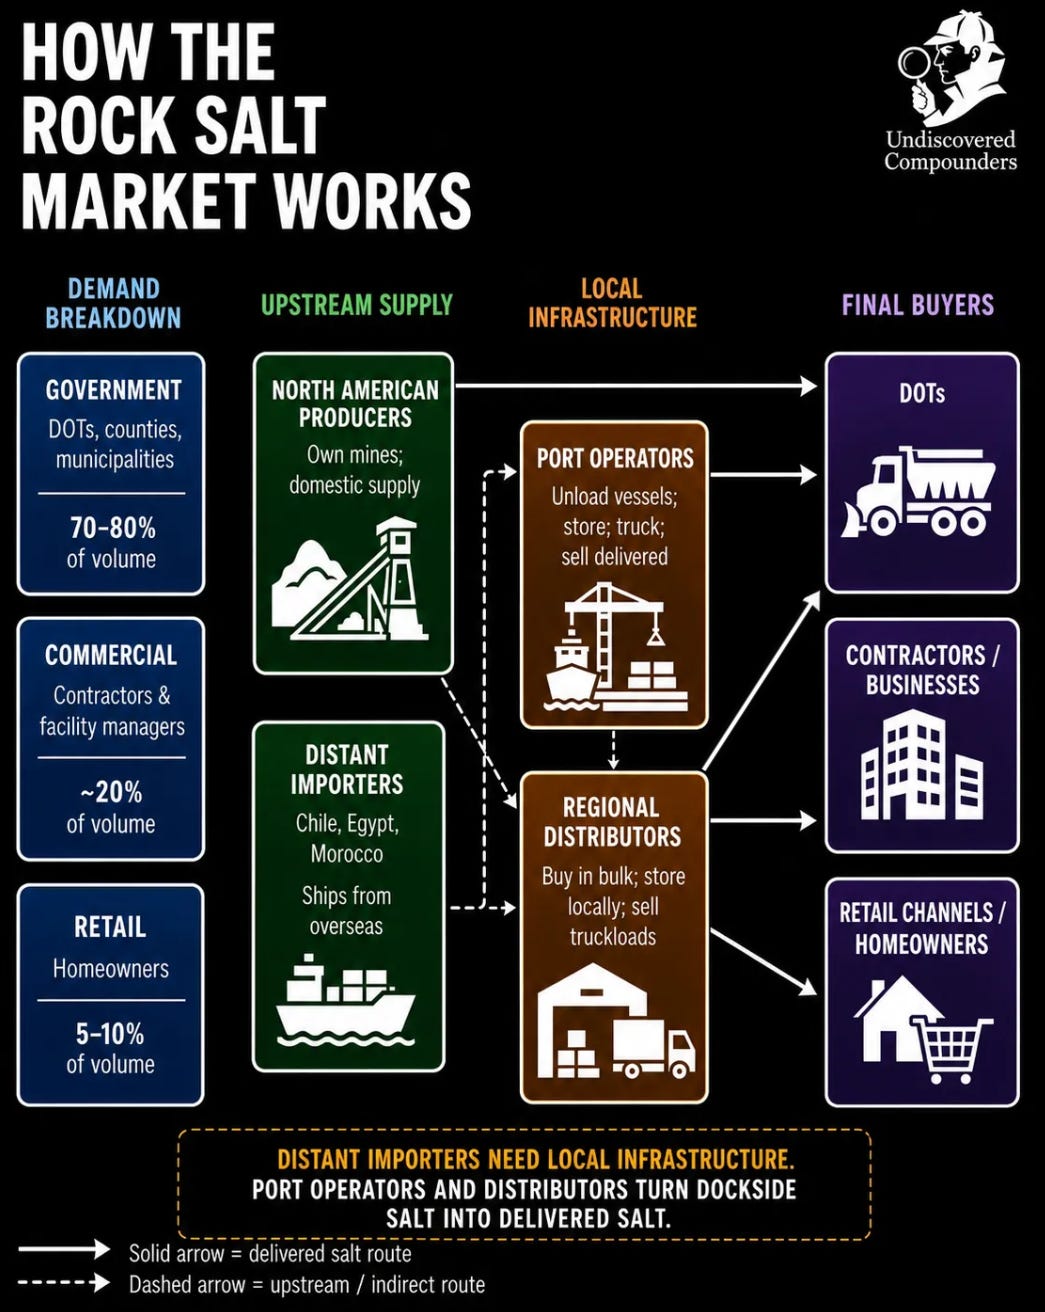
On the seller side, 4 structurally different types of players exist. Each controls a different bottleneck.
The first is the integrated producer. Compass Minerals owns the Goderich mine, operates the mine-site loading infrastructure, controls an extensive network of regional storage depots, contracts for bulk vessels, barges, rail, and trucking, and sells directly into public-sector contracts. This end-to-end integration took decades to build, but it allows the producer to invoice on a delivered-price basis. Almost all major North American rock salt producers are integrated this way, and that is part of what makes the segment effectively closed to direct competition.
The second is the port operator. Take Eastern Salt. It does not need to own the mine. It owns or controls the local bottleneck: bulk vessel unloading, storage, trucking, and relationships with public buyers. Eastern Salt buys imported salt from foreign producers, brings it into its terminal, stores it, and resells it at a delivered price to the same public buyers. Without this intermediary layer, distant importers would struggle to sell physical tonnes into the United States.
The third is the regional bulk distributor. Companies like Midwest Salt, Ninja De-Icer, or SISCU. They do not mine anything. They buy in volume from integrated producers, from port operators, and sometimes directly from exporters, then they store the salt in their own depots and resell it in flexible truckloads to the thousands of contractors no integrated producer wants to serve directly. They run 24/7 in season and deliver next-day, sometimes same day. They’re the lubricant that lets an already-tight system function, until the salt itself becomes the constraint. Lately, that has meant many winters (more on the causes and consequences later). Without them, the commercial tier collapses.
The fourth is the distant importer, mainly Chilean, Egyptian, and Moroccan producers. They load a bulk carrier at the port of origin, cross the ocean in two to four weeks, and unload dockside in Boston, Philadelphia, or Baltimore. They own nothing in the United States. They sell to a port operator or to a distributor with import capacity, and that buyer takes it from there. What makes their model economically viable despite the distance is their extremely low FOB port (Free on Board, the price at the port before shipping costs): dry climates that allow solar evaporation, lower labor costs, open-pit mines with no underground CapEx. Even after 2-3 weeks of ocean freight, the dockside cost in Boston can still remain competitive.
Integrated North American producer, port operator, regional distributor and distant importer. There is one box with no relevant occupant today: a North American producer that sells dockside without downstream integration, the way an exporter would, but a few days from the market instead of a few weeks. No great mystery here: no new rock salt mine has opened in North America in nearly twenty-five years, and the existing mines are almost all integrated by historical inheritance. Atlas Salt could therefore establish a new category, unless it is acquired first (a scenario we’ll cover later).
In short, here is the structure of the deicing rock salt market:
Demand That Does Not Bend
About 70% of U.S. roads are in snowy regions, and nearly 70% of the population lives there. Most deicing salt consumption is concentrated east of the Mississippi. Highway deicing alone accounts for about 41% of total U.S. salt consumption.21 That single application ties year-to-year deicing demand to one variable above all else: how harsh the winter is. “Harsh” here means the frequency of precipitation events that cross the freezing threshold, not temperature alone. Several low-snowfall icing events can consume more salt than a single large storm, which is “good” news for suppliers, because those events occur more often.22 Even during normal winters, North America still imports 8 to 10 Mt of deicing salt, leaving a clear source of demand for a new local supplier able to deliver more reliably.23 Atlas Salt is the only new local greenfield supply candidate positioned to fill that role. The only one in decades.
On the downside, demand has a built-in floor. State DOTs and provincial transportation agencies operate with minimum stockpile targets regardless of how mild the previous winter was. A warm season spreads its demand reduction across subsequent years as agencies draw down reserves before reordering. Private contractors operate much the same way, although they are often the last to be supplied and the first to return to the market when winter conditions turn severe. This asymmetric structure is what makes the market so attractive: demand can surge in any given year, but it rarely drifts far below its baseline. And it shows in the price. Over the past 40 years, U.S. rock salt PPI has compounded at 4% per year versus 2.8% for CPI, and the largest cumulative price decline never exceeded 10%, outside of post-spike corrections. On a chart, it looks like a compounder on a log scale.
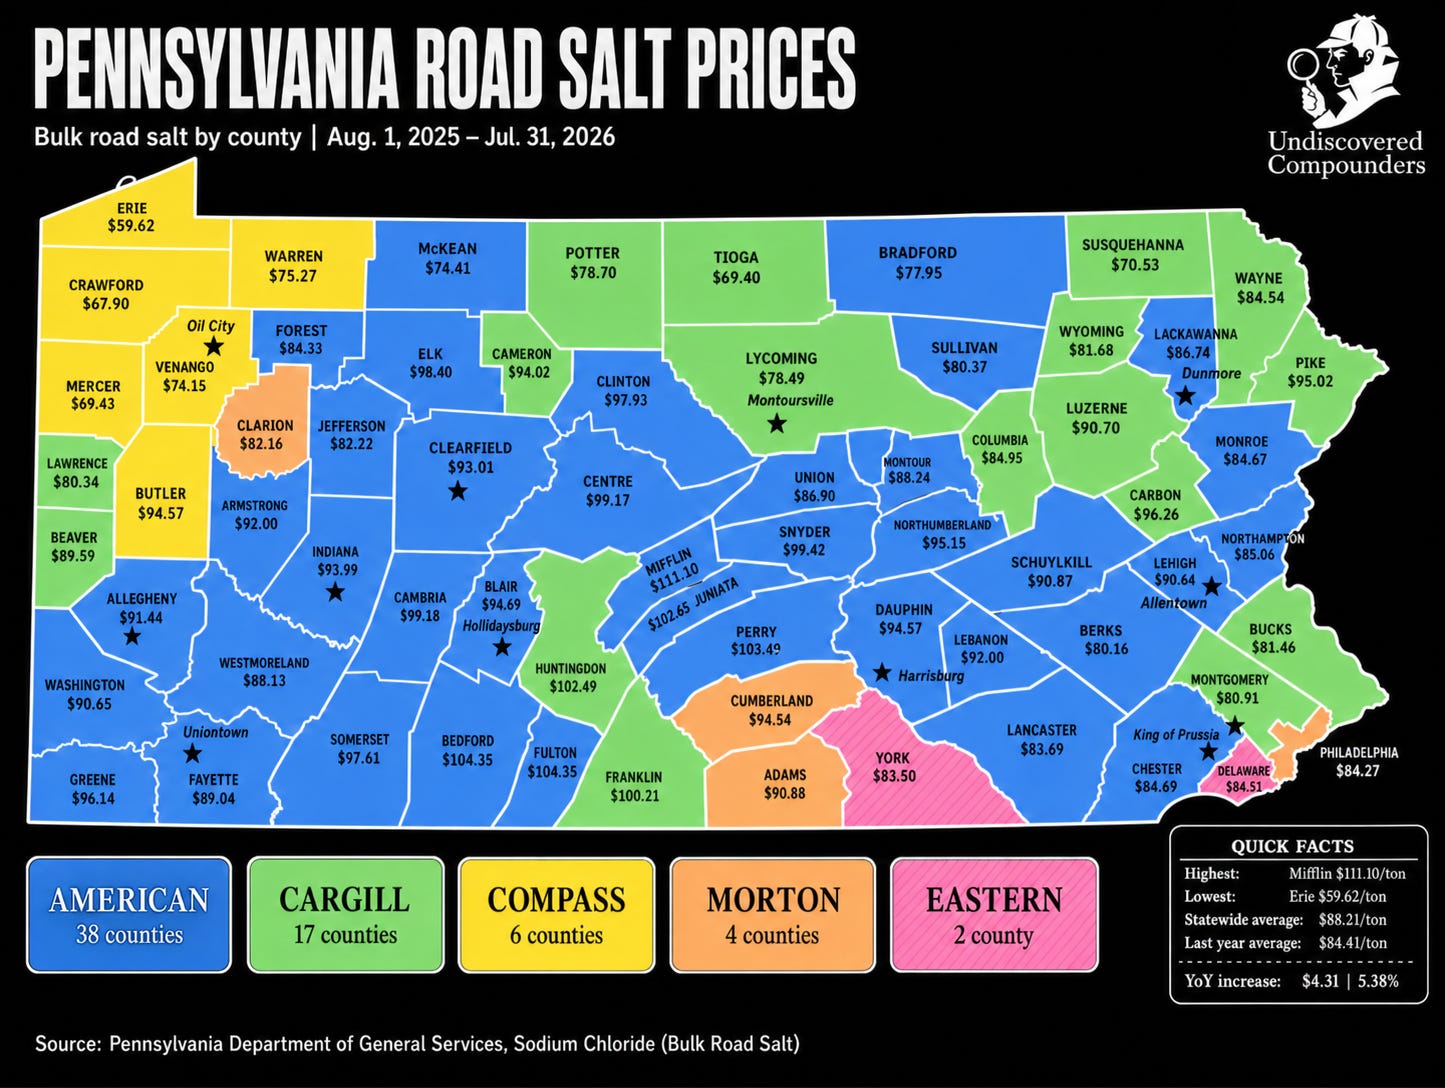
This chart is one of the most important in this investment thesis. Salt price is the single most important variable in the investment case, by far. The BLS index tracks the prices received by domestic rock salt producers on their first commercial sale, whether to a DOT or through an intermediary. National, weighted, and smoothed by design. It hides three things.
First, geographic price dispersion: a DOT hundreds of miles inland pays far more per tonne than one next to a lake port, because salt’s low value-to-weight ratio means logistics dominate the delivered cost. The national average erases that gap. Second, downstream markups: the index captures what the producer receives, not what the distributor charges a private contractor three layers down. Between the mine gate and the parking lot, margins expand significantly. Third, and most importantly, spot pricing: the channel where both DOTs and private contractors scramble for every available tonne when winter runs harder than the procurement contracts anticipated.
That spot market is where crisis prices live. Ontario’s 2025-26 winter is the extreme case, but the same mechanism plays out at a smaller scale in many harsh winters, invisible in the headline index. The chart is therefore a proxy for producer pricing with the upside spikes flattened. It hides the operating leverage of every salt producer. In the valuation section, this chart will be our base case. Note that spot-price spikes tend to flow through into the next contracting season, as buyers and suppliers reset expectations around scarcity and replacement cost. Given the spot-price spikes observed in several regions during the 2026 winter season, contracted salt prices are likely to move higher in the next tender cycle.
To understand why public buyers end up paying several times the normal price,24 you have to think like them. As always, it comes down to incentives. Research on a 30-mile Iowa highway segment found accidents increased 1,300% when maintenance was disrupted during severe winter weather events, even as traffic volume fell.25 That 14x multiplier translates into lawsuits, emergency response strain, and political cost for whoever made the call. No politician on either side of the border wants to be the person who let roads go unplowed. Cities apply salt at the first sign of freezing precipitation, and keep applying as long as the supply holds. Private snow-removal contractors operate on the same arithmetic, through a different legal regime. A slip on an unsalted parking lot can become a lawsuit against the property owner. The incentive structure is identical; only the courtroom changes. For both public and private entities, when salt is needed, the money is found.
But sometimes there is simply no salt. The 2008-09 season was the clearest example: depleted stockpiles from the prior winter + Mississippi flooding + hurricane-damaged Louisiana mining equipment = a perfect storm. Iowa DOT opened bids for 31 locations and received… zero offers. The first time in the state’s history. I’ll let you imagine what that meant for the municipalities on the other end of those bids.26
And the public buyer still gets the “better” end of the deal. Private contractors sit below municipalities in every producer’s allocation queue. In early 2026, major suppliers like Morton Salt suspended commercial accounts across several states to prioritize public-sector contracts.27 Contractors received a single-line email from their distributors: “Everybody’s cut off. No more salt.”28 Around the same time, American Rock Salt raised its commercial price by $25 per ton in New York.
Demand is locked by public safety mandates and commercial liability, floored by winter stockpile behavior, prone to spike when winter runs harder than planned, with no viable substitute at any point in the cycle. Whatever goes wrong in this market, it won’t be on the demand side.
A Supply Base Frozen Since 2001
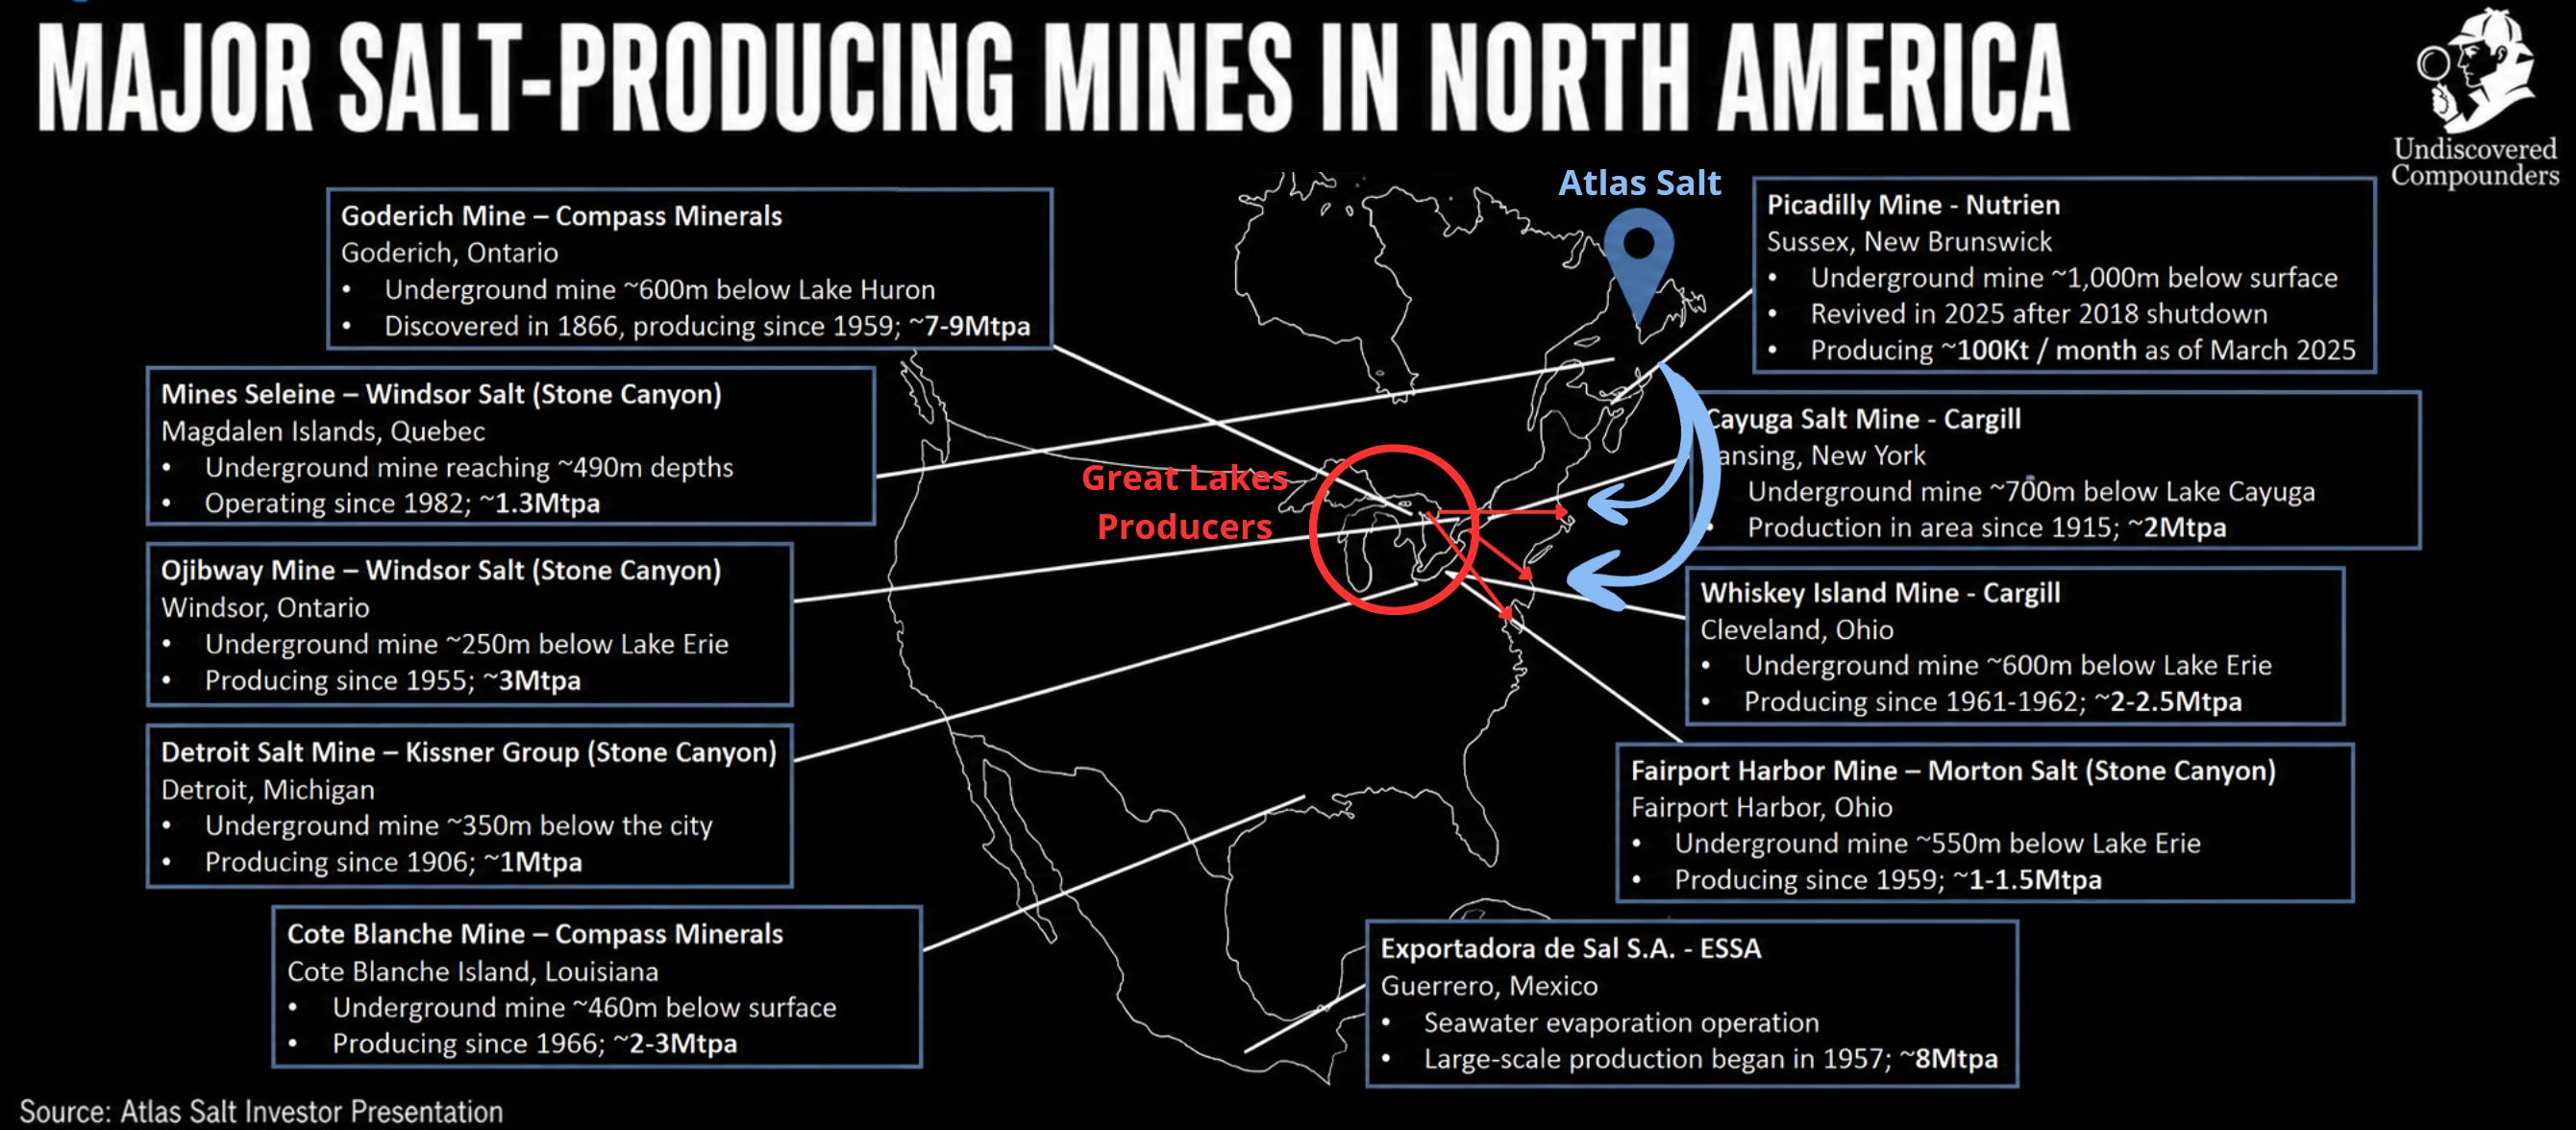
U.S. rock salt production in 2019 was 19.1 million tonnes.29 North of the border, the eastern supply base is heavily anchored by one asset: Compass Minerals’ Goderich mine, which produces approximately 7.25 million tonnes per year from 1,800 feet beneath Lake Huron. But rock salt does not only serve deicing; it also feeds chemical, industrial, and agricultural markets. Once those volumes are accounted for, domestic North American rock salt production falls well short of deicing demand alone. North America must import 8 to 10 million tonnes of deicing salt every year just to keep roads clear.
That gap is the persistent consequence of a supply base that has not expanded in over two decades while demand has quietly grown with population, road networks, vehicle miles, and service-level expectations.30
At the mine gate, U.S. rock salt is a low-value commodity, with benchmark prices around $50-$60 per tonne.31 Not an operating cost, but a producer-level selling price. But that mine-gate price can become an afterthought. In some lanes, transportation costs can exceed the value of the salt itself. This is why geography is the moat: the mine closest on the efficient shipping route usually wins. Short-sea shipping moves the same tonne for a fraction of what trucking costs. The mine closest to a deepwater32 port can serve the largest addressable market. A mine without port access serves whatever fits inside its trucking radius.33 Keep that in mind.
The last new rock salt mine built in North America began production around 2001. Before that, there had been no new mine for more than fifty years. The reason is purely economic: salt deposits are vast and widely distributed, but the revenue per unit is too low to justify the capital expenditure of a greenfield operation unless the logistics are exceptional.34 Even expanding existing mines is difficult: regulatory agencies may require complete facility upgrades to current standards if operators seek permits for new sections, creating compliance costs that are simply prohibitive.35
The major producing base is aging.36 Many of these mines sit hundreds of meters underground, beneath lakes or urban areas, with environmental and permitting constraints. Goderich is the clearest illustration. The mine experienced geological movements that disrupted production in 2017, followed by a three-month worker strike in 2018 that tightened supply across both sides of the border.37
And it is getting worse. Since 2021, North America has lost about 1.5-2.5 Mtpa (million tonnes per annum) of domestic capacity with the permanent closure of Cargill’s Avery Island mine (operating since the mid-1800s). Another 5.5 Mtpa remains in uncertain hands: Cargill’s remaining U.S. assets, both beneath lakes, have been listed for sale since 2023 with no buyer in sight.38 Compass Minerals, operator of the continent’s largest mine at Goderich, is under financial pressure: cutting production in 2024-2025 to pay down debt after a failed lithium diversification, a class action settlement, and a particularly damaging food-grade recall.39 Stone Canyon, North America’s largest salt producer by total volume, is digesting $5.2 billion in acquisitions.40 The rest are either absorbed in integrating existing assets or too regional to move the needle.
In this aging and saturated landscape, one name emerges: Atlas Salt, the only greenfield rock salt mine project in North America in 25 years with a completed feasibility study and early works underway. That scarcity is not a coincidence. The project has structural advantages that make the math work where it has not worked for anyone else in a generation. But that is only one project. For now, the continent still has to fill the gap somewhere else. It imports.
Import Dependence, Weeks Away
Deicing is the most important end use for imported salt. The question is where those 8-10 Mtpa come from, and what constraints they face.
After Canada, Mexico is the closest large foreign source for U.S. salt imports. But Mexican solar salt serves the U.S. West Coast and Asia almost exclusively. For the North American East Coast market, Mexican salt is out of the picture.41 Chilean and Egyptian solar/rock salt reaches the East Coast by ocean, a journey of 14 days or more. It is produced cheaply thanks to low labor costs, low extraction costs, and proximity to deepwater ports.42
When everything lines up, this system works. Imported salt can arrive at the same price, sometimes even cheaper, than the domestic product. It takes lower foreign production costs, favorable exchange rates, and ocean freight rates that undercut overland rail and trucking.43 But that cost advantage rests on everything going right, and it can reverse the moment one variable moves against them. Right now, with Brent having doubled in four months, nothing lines up for foreign salt exporters. And even if fuel prices collapsed tomorrow, cost is only the first problem; the others are time, priority, quality, and recourse.
Even when the salt arrives, it is not necessarily reliable. Distance means less visibility and less control over the counterparty. When a buyer sources foreign salt, it may not know whether it is dealing with a broker or the mine owner, whether its order will be prioritized, whether the product delivered will match the quality purchased, how long the vessel will wait before loading, or what dispute process exists if something goes wrong. Available salt can still become a reliability problem. And even if everything goes well, salt sitting two weeks away by boat cannot help a municipality that runs out of inventory in the middle of a storm. Only a few local producers can.
The policy environment has become less… comfortable with distant imports too. Non-USMCA sources like Chile, Egypt, and Morocco have also faced Section 122 surcharges of 10% following the February 2026 Supreme Court decision.44 USMCA-compliant Canadian salt enters duty-free.45 So far, Canadian road salt has remained outside the main U.S.–Canada tariff pressure points. Canadian rock salt qualifies as USMCA-originating by default, and USMCA-compliant goods remain exempt from the IEEPA tariffs hitting most other Canadian exports. Even if that changed tomorrow, the math would not move much. The deficit is too structural for buyers to source elsewhere, the end customer is a municipality that has to keep the road open, and most North American producers run on margins too thin to absorb a tariff themselves.46 The cost would land where it often lands in tight markets: on the U.S. consumer.
The U.S. has tried to promote domestic salt production, but policy cannot override physical reality. New York’s Buy American Salt Act (December 2022) allows state agencies to prefer U.S.-mined salt when the bid is within 10% of the lowest offer.47 But in practice, the policy mainly exposed how fragile domestic logistics still are. After the 2024-25 shortage, New York officials stepped back from applying the preference to the next road salt solicitation, explicitly stating that the Buy American Salt Act preference would not apply to the 2025-26 replacement contracts.48 They still need imports, and they need them nearby.
A demand floor with sharp spikes, and a supply base that shrinks to local producers when winter bites. In the middle of all this, Great Atlantic Salt is 2 km from a deepwater port on the Atlantic seaboard. The project alone cannot close the entire gap, but its economics are built around this market structure.
What’s left is where supply and demand meet: the price.
Pricing Without a Market
Salt has no liquid futures contract, no exchange-traded benchmark, and no transparent spot market. Pricing happens through negotiated physical contracts, awarded months before winter, or through emergency quotes when everyone is chasing the same tonne of salt.
Contract prices tend to move gradually upward, while emergency prices can reset violently when inventories run short. The buying logic is starting to move from pure lowest-cost purchasing toward security of supply, especially after the shortages of 2025 and 2026. That shift structurally favors domestic producers with proximity to end markets and the ability to respond within days. Atlas Salt can deliver salt in under three days to the nearest East Coast cities (Boston, New York, etc.).49
There is another slice of the deicing market I’ve barely touched so far. It is small in volume, but it plays by completely different economics.
Where the Margins Are
In sales to public buyers, producer margins are thin. The counterparty is a government entity with a public-safety obligation to keep roads usable, and sometimes a legal obligation to do so. This is the floor.
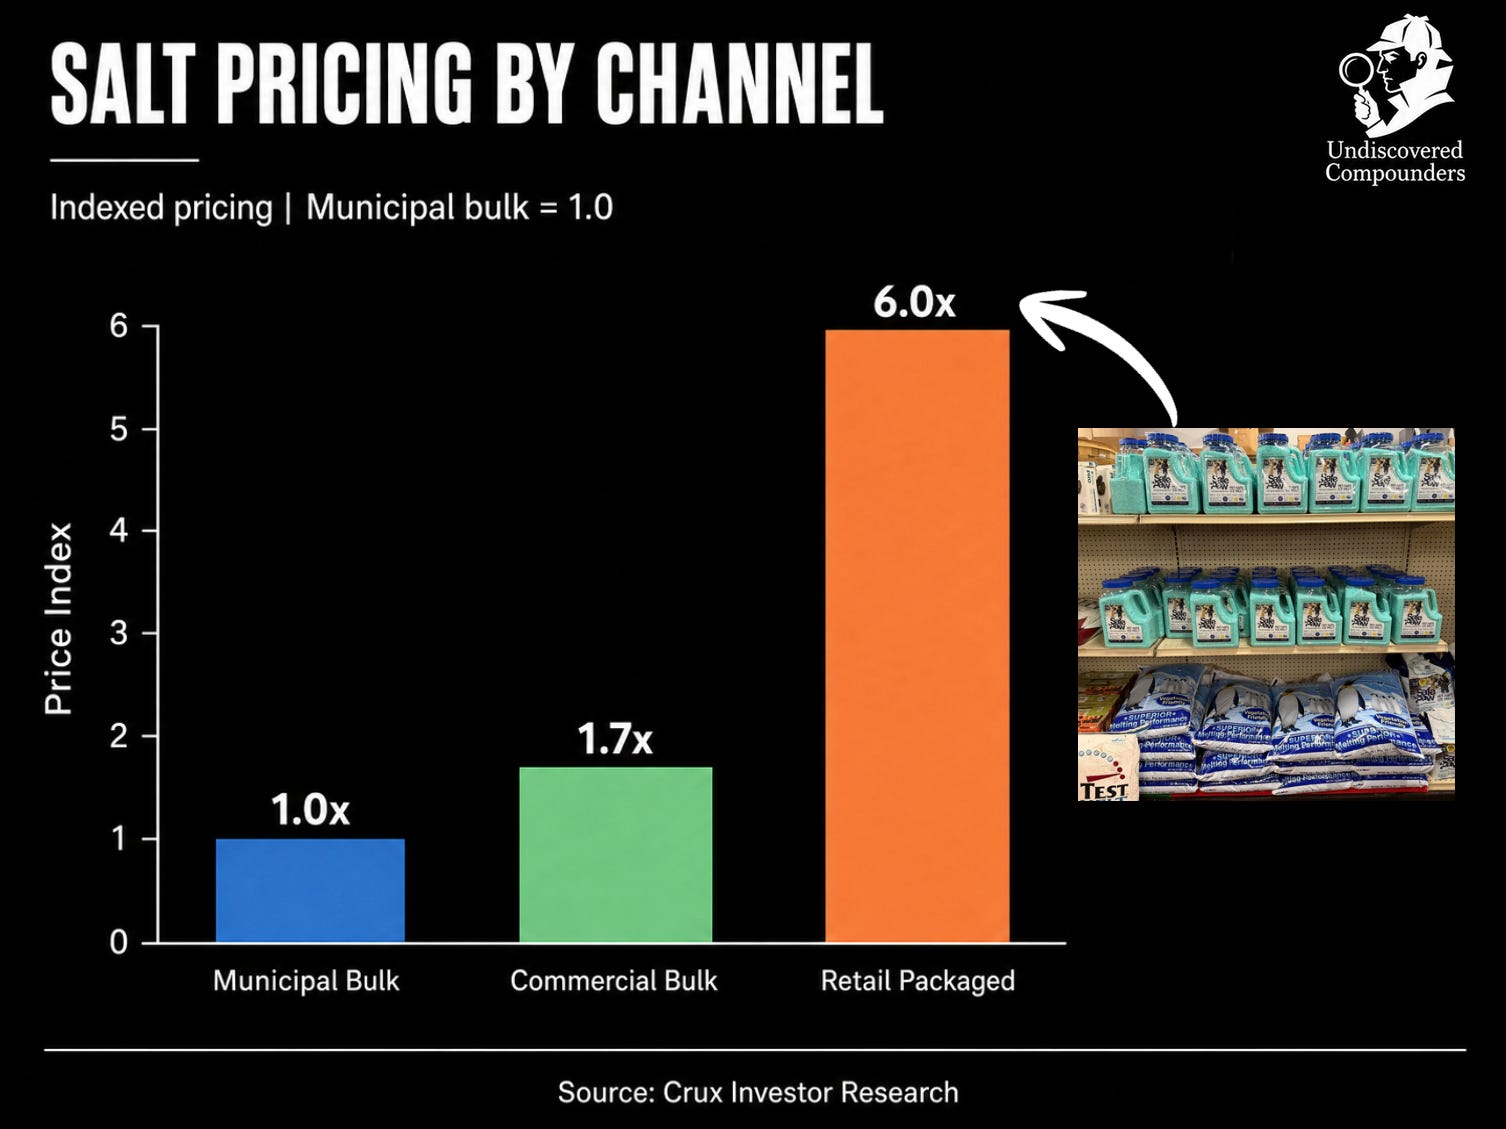
Now take that same salt, bag it, slap a brand on it, and put it on a shelf at Home Depot. At the producer level, packaged salt already sells for almost 2x bulk. By the time it reaches retail, the multiple expands to approximately 6x. Make no mistake: it is the same salt: same NaCl, same purity, same mine. The markup is mostly a function of packaging, distribution, and channel access.
This is why evaluating a salt producer on average revenue per tonne is misleading. What matters is which channels they can reach: packaging lines, logistics networks, and shelf space at major retailers. Few producers have all three. Atlas Salt does not, and probably never will, at least not directly. That said, the company is already trying to capture part of those higher-margin segments through partnerships.
Climate & Environment: The Objections That Do Not Stick
Two objections come up every time someone looks at this market, and they deserve answers before we move to the setup. Both sound reasonable, but neither survives contact with the data.
The first: climate change will kill winter salt demand. No data points in that direction. Instead, climate change is changing the shape of demand. Total precipitation across the Great Lakes states has increased 14% since 1951, while the heaviest 1% of storms have become both wetter and more frequent.50 Warmer average temperatures shift more of that precipitation from snow to rain, and specifically to freezing rain, which can consume more salt per event than snowfall. Researchers studying county-level records from NOAA’s Storm Events Database from 1996 to 2025 found that freezing rain events are not declining. Instead, they are shifting in location and timing, moving later in winter and expanding into regions less prepared for them.51 As one research team put it52:
“We want to make an urgent warning that these kinds of winter hazards won’t be less frequent under a warmer climate.”
Climate change makes deicing salt demand less predictable, more concentrated in peak events, and more punishing when supply cannot respond. That, once again, favors producers with proximity.
The second: environmental regulation will restrict road salt. Here the picture is more nuanced. The pressure is real: chloride accumulates in freshwater systems, and the EPA sets toxicity thresholds at 230 mg/L for chronic exposure. Several states have tightened water quality standards. But the regulatory response on the East Coast has been the same: optimize application, do not eliminate it. Pre-treatment brining, calibrated spreaders, GPS-controlled application, anti-icing strategies, and operator training are already part of the toolkit across public winter-maintenance programs.53 No relevant jurisdiction has moved to ban or materially restrict road salt use. The reason is the same one that makes this market what it is: there is nothing else that works at scale for the price.54
Climate change raises the peaks and, in some regions, the floor. Every efficiency gain of the last fifteen years has been absorbed by rising demand. Rock salt consumption is higher today than it was before chloride in rivers became a water-quality concern.
Where This Leaves Us
Every structural feature of this market shows up in a producer’s income statement: revenues, margins, cash flows.
Six structural facts, each compounding the next:
Demand that does not bend, locked by public safety mandates and by slip-and-fall liability on the commercial side, floored by winter stockpile behavior, compounding at nearly 4% a year for four decades in the floor case.
A supply base that has not expanded in twenty-five years and is showing stress: mines closing, producers under financial pressure, and capacity for sale in a market that still needs more local supply.
An 8-to-10-million-tonne structural import gap filled by salt that takes two to three weeks to cross an ocean.
No economic substitute at scale.
Climate change making demand less predictable and more peak-loaded.
A procurement model shifting from lowest-cost to security-of-supply, rewarding exactly what distant imports cannot offer: proximity and reliability.
This is a market that has already broken, visibly, and repeatedly. The structural conditions that caused the break are getting worse. Ontario in January 2026 was the system behaving exactly as designed, with no slack left.
Into this market, one company is building the only new salt mine in North America in over a generation. A shallow, high-purity deposit. Two kilometers from a deepwater port. An Atlantic port open while the Great Lakes are closed. Completed feasibility study. Environmental approval secured. Early works underway. And a valuation that prices in almost none of it. Even less of the market it sits in.
That brings us to Great Atlantic itself.
03. Atlas Salt’s Mine: Great Atlantic Salt
Atlas Salt is, for underwriting purposes, a single-project company. The asset is the Great Atlantic Salt deposit, in western Newfoundland and Labrador (Canada). Here’s why this is the first greenfield rock salt project in 25 years to clear every barrier that has kept new salt mines out of North America.
Methodological note: Unless otherwise footnoted, company-specific information comes from Atlas Salt’s recent public disclosures. Most of it is drawn from four documents: the Updated Feasibility Study, the 2025/2024 MD&A, the 2025/2024 annual financial statements, and the investor presentation.
The Deposit
Start with the rock itself. Atlas’s September 2025 Updated Feasibility Study (UFS; remember this acronym, because I’ll use it a lot) outlines a 24.25-year mine life based on 95.0 million tonnes of Probable Reserves grading 95.9% NaCl (sodium chloride, common salt). Those reserves sit inside a much larger resource envelope: 383 million tonnes of Indicated Mineral Resources at 96.0% NaCl, inclusive of the reserves, and 868 million tonnes of Inferred Mineral Resources at 95.2% NaCl. In plain English, the current mine plan uses 95 Mt, while approximately 288 Mt of additional Indicated Resources and all 868 Mt of Inferred Resources remain outside the reserve-case mine plan. All three categories exceed the 95% NaCl road-salt specification referenced in the UFS. The salt does not need beneficiation or chemical upgrading. Once crushed and screened to specification, it can be sold as road salt.
Mineral Reserves are the drilled, tested, and engineered part of the deposit, with enough confidence to support a bankable mine plan. Indicated Resources carry less confidence than reserves. Inferred Resources carry less confidence again.
The 24.25-year mine life in the UFS has to be understood on those terms. It is a planning horizon built on the Probable Reserve base. SLR, the firm that prepared the UFS, made that explicit: further drilling during production could convert additional material into reserves, and the expansion case extended mine life to 47.5 years, on partial reserve support and with no commitment that the plan would ever be executed.55 The UFS cannot capitalize those later tonnes in reserve-case cash flow today, while management has little economic reason to spend aggressively to prove year 50 before year one exists.
Bedded salt deposits like Great Atlantic tend to convert inferred resources to reserves at rates metal projects rarely match. The deposit is homogeneous, laterally continuous over kilometers, high purity, and grade appears not to vary meaningfully across the envelope. For a mining project, that is exactly the kind of geology you want: boring, repeatable, and hard to misread. Goderich, now Compass Minerals’ flagship mine, became the world’s largest underground salt mine from a remarkably thin original drilling base: 16 vertical core boreholes drilled in the 1950s, later validated by six decades of mining.56 Atlas has drilled forty-eight holes in a shallow, laterally continuous deposit.57
The UFS cannot price what is not yet a reserve. That’s the rule, and SLR follows it: Approximately 288 Mt of Indicated Resources beyond the reserve base, plus the 868 Mt of Inferred Resources, sit outside the reserve-case mine plan and the NPV. I’m not bound by that rule. I could assign part of that 1,156 Mt base a probability-weighted value, based on the geology and the historical track record of bedded salt deposits. I’m not going to. I’m leaving it as free upside. The 95 million tonnes of Probable Reserves are already enough for the thesis.
But there is more. Management’s view is that, once underground, the mine may be able to keep moving horizontally beyond the current reserve, then beyond the current resource, and eventually into undrilled ground. If true, this could translate into lower sustaining capital, lower development cost, and lower unit operating cost than the reserve-constrained UFS can model today. Think of the mine as a stack of levels. Opening a new level is more expensive than extending development horizontally within an existing one. So if Atlas can recover more tonnes than planned from the same level, the economics improve: the fixed development cost is spread over more salt. But again, the UFS cannot include that in the reserve-case economics today. And again, I leave it out, more for lack of data than out of excessive conservatism.
Transport Logistics as a Moat
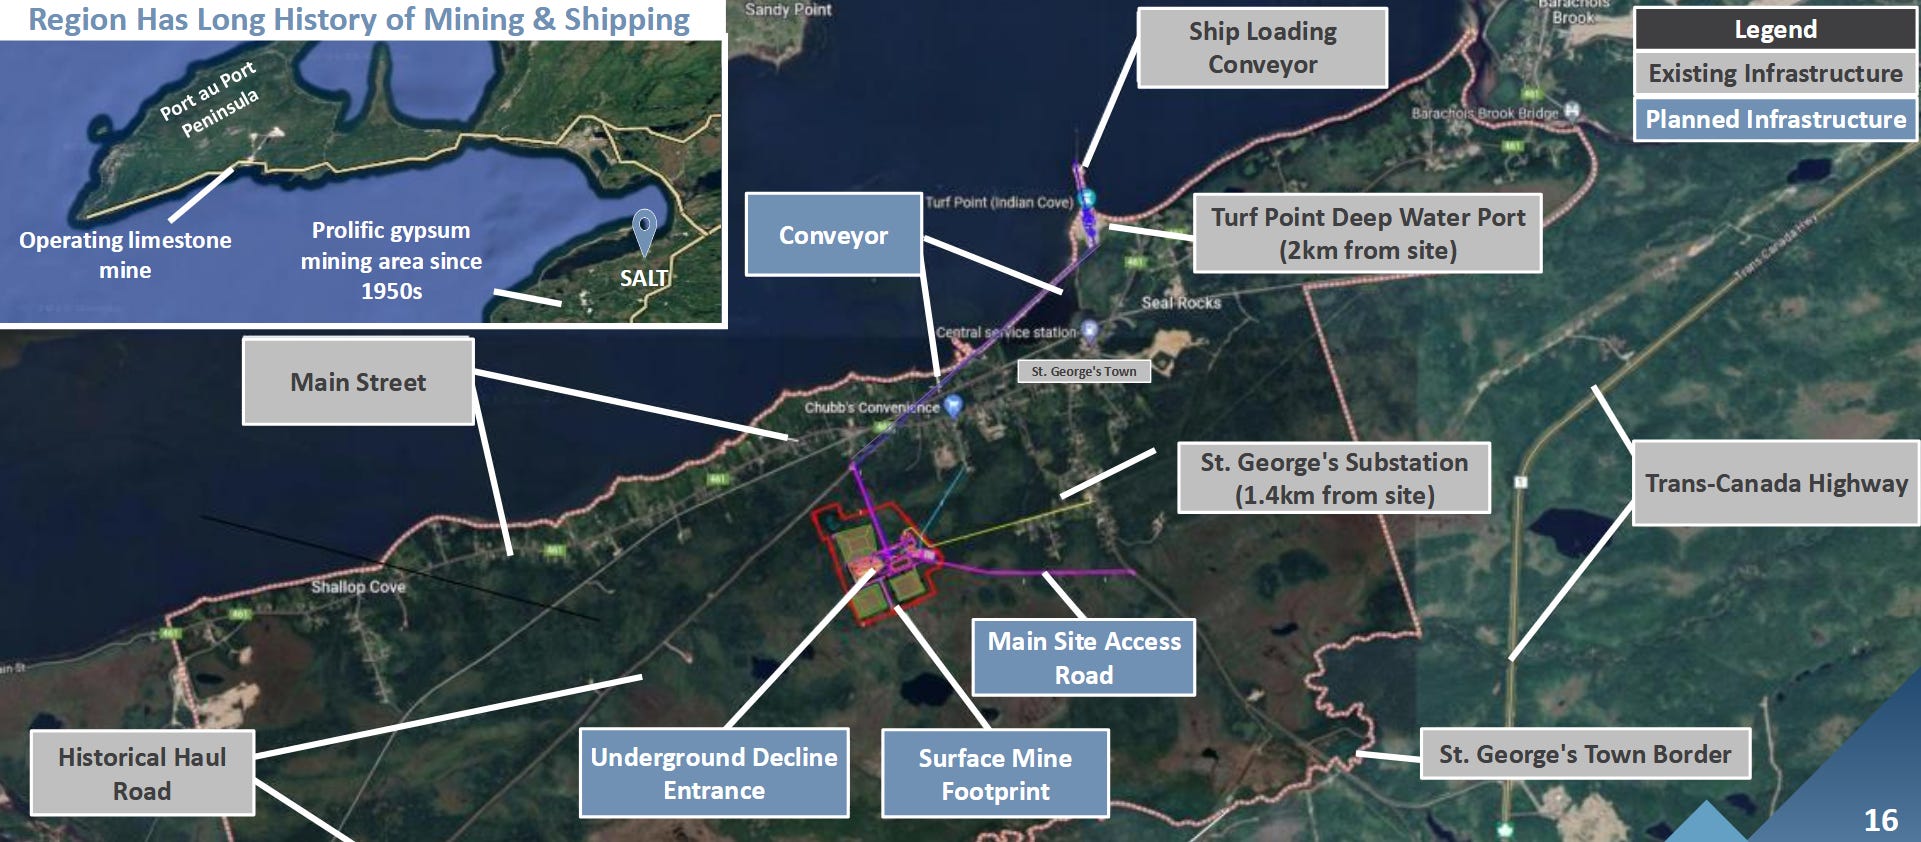
Once purity and gradation specs are met, deicing rock salt is largely interchangeable. Geography, and the logistics that flow from it, are the moat. Atlas is built around that.
The project sits two kilometers from Turf Point, a deepwater port on the west coast of Newfoundland, with direct access to Atlantic shipping lanes. The design calls for a conveyor linking the mine directly to a ship-loading facility sized for Handysize and Handymax bulk carriers.58 No trucks, just a modest line item in initial CapEx and ongoing maintenance, and the mine-to-port leg is solved upfront. If built as planned, Great Atlantic would be able to serve Boston, New York, Philadelphia, or Baltimore within a 3‑ to 5‑day round trip, narrowing that gap between import lead time and emergency demand in a way Goderich, Cote Blanche, or Chilean and Egyptian salt simply cannot match on the same winter-response basis.
It gets worse inland. Cargill’s remaining U.S. mines and Compass Minerals’ Goderich rely on the St. Lawrence Seaway and the Welland Canal for waterborne access, which close every January and reopen in late March.59 That is exactly when a harsh winter tears through contracted tonnage: DOTs hit their contracted volume ceilings, private contractors run dry, and the spot market takes over. At that point, price is set by whatever tonne can actually reach the customer. Great Lakes producers go silent for ten weeks every winter, restricted to overland delivery within trucking range. Atlas could keep shipping.
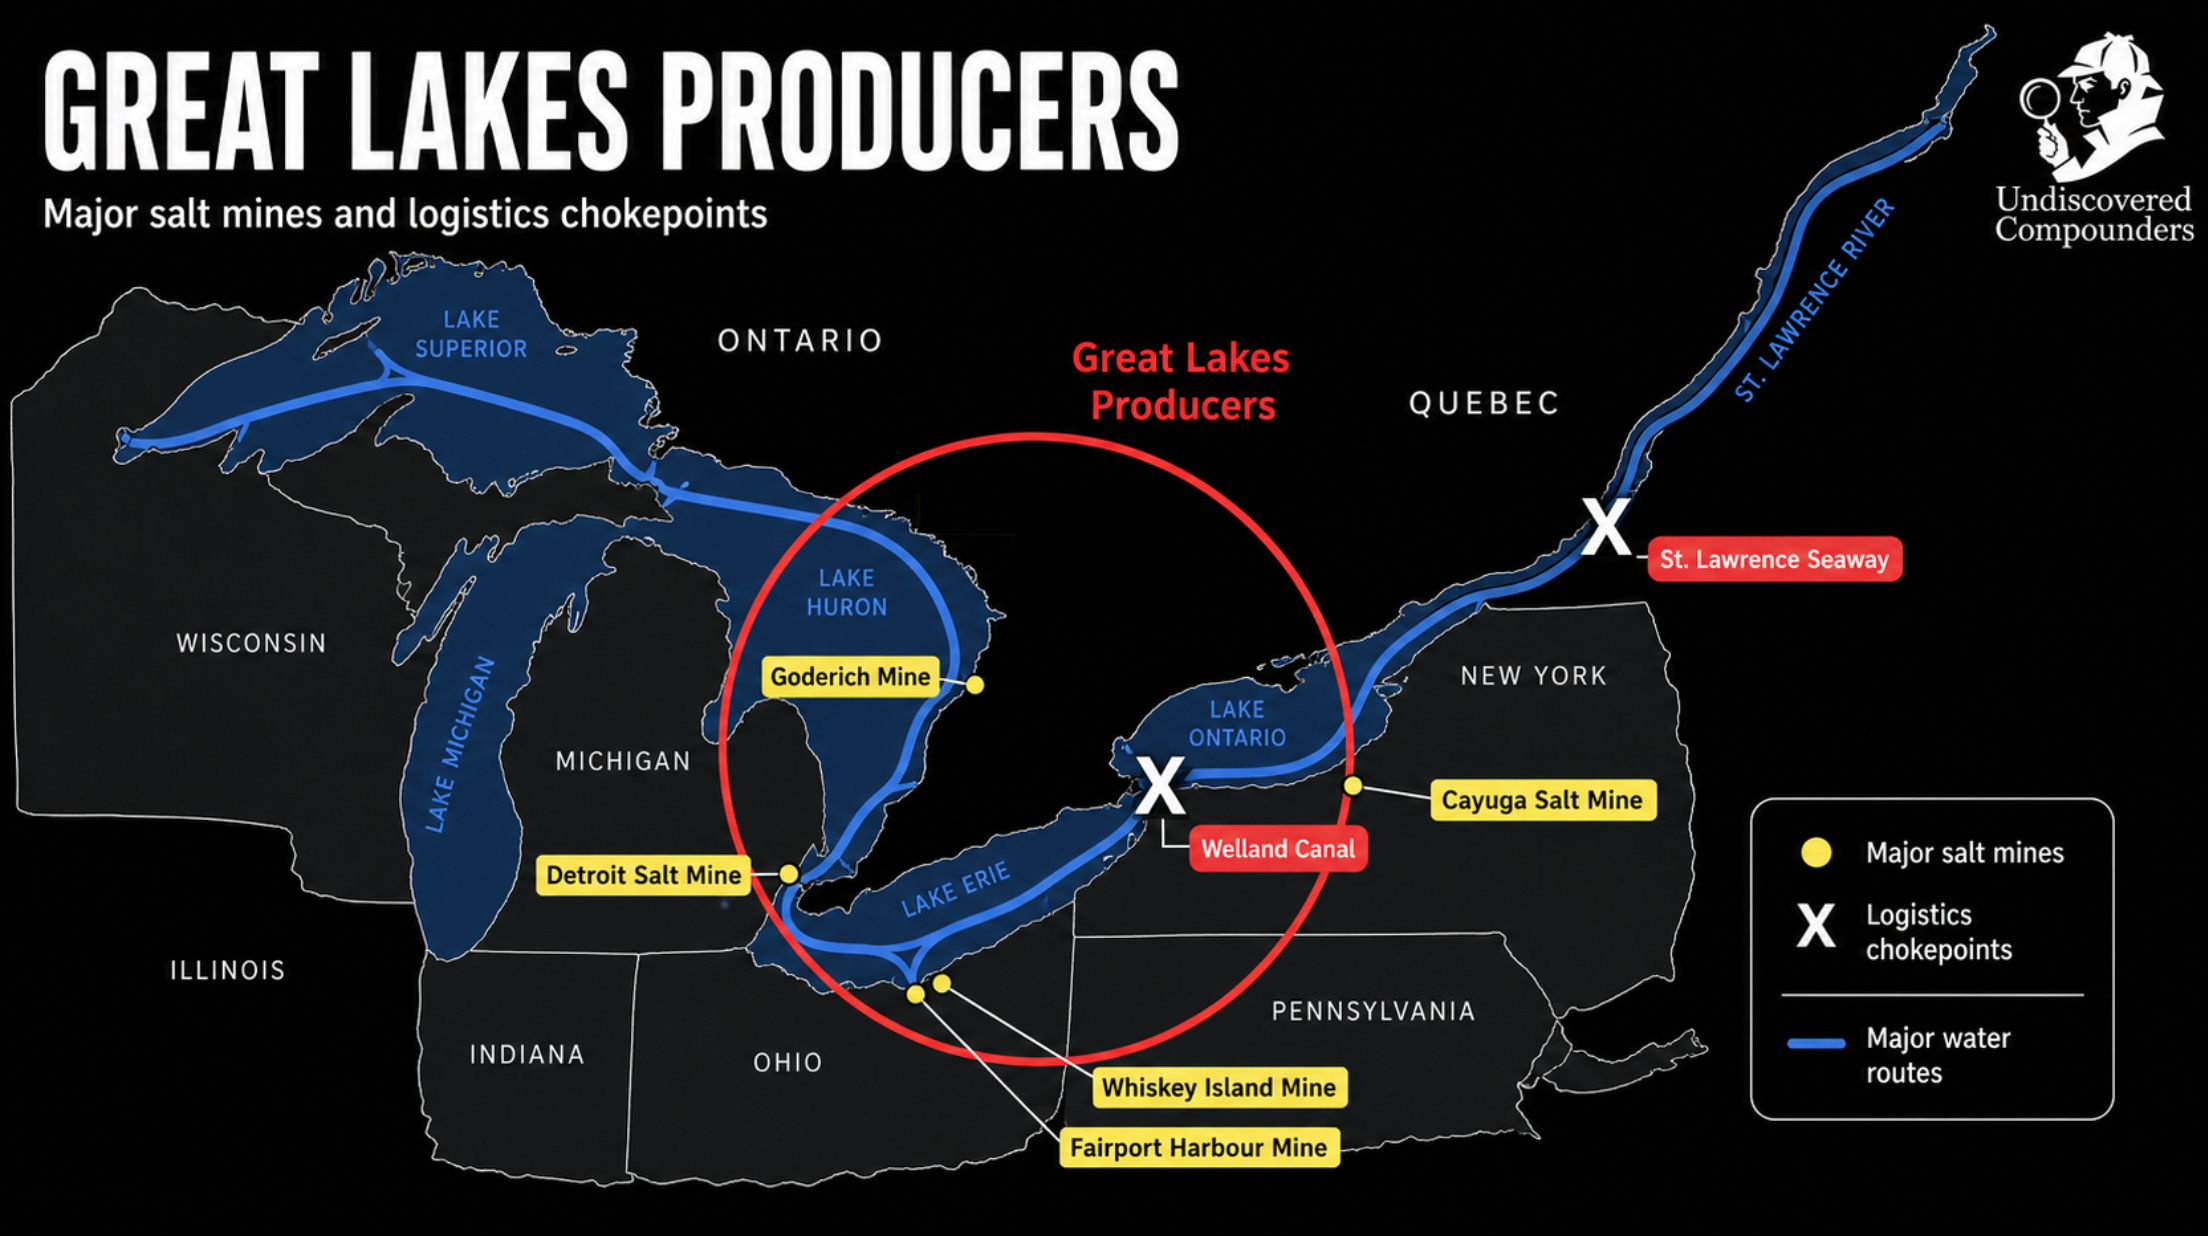
The rest of the year, when the Seaway is open and everyone bids into the same public tenders, Atlas’s positioning should still win on distance to market. A short North Atlantic haul to Boston, New York and Philadelphia beats the Great Lakes detour from Goderich, and beats anything Chilean or Egyptian supply can put on a two-to-three-week ocean route. The geography pays in every season, but it also costs something.
Management has built Atlas’s logistics pitch around this advantage, describing Turf Point as “year-round with no seasonal ice closure.”60 That needs one clarification. Turf Point sits in St. George’s Bay, a sub-basin of the Gulf of St. Lawrence that the Canadian Coast Guard designates as Ice Zone Area 2, with a formal ice season running December 21 to April 15.61 This is not the same as being ice-free. However, the Gulf remains navigable through winter with icebreaker support, while the Seaway physically closes. Commercial vessels over 200 gross tonnage transiting an ice zone during the ice season pay a Canadian Coast Guard icebreaking fee. For the 2025-26 fee, that rate is C$3,818.61 per transit.62 Under plausible assumptions about vessel size, billing mechanics, and how much of Atlas’s shipment calendar falls inside the ice window, that translates into somewhere between C$0.03 and C$0.10 per tonne shipped in direct icebreaking fees.63 Against the UFS LOM operating cost of C$28.17/t, it is a rounding error.64
The logistics advantage is physical, but it is neither free nor fully built. Turf Point is an existing third-party-owned port, already operating as an aggregate export facility. Atlas also ships small amounts of gypsum from its Flat Bay mine through Turf Point.65 The existing trestle, ship loader, and caissons can already handle Handymax vessels. What Atlas plans at Turf Point is a brownfield expansion: a new 47,300-tonne storage building, refurbishment of the trestle and ship loader, reclaim conveyors, dredging, and one additional mooring caisson. The UFS puts the port line at C$58.5 million, about 10% of the C$589 million initial capital. That creates normal construction and logistics risk. A second risk, more upstream: no commercial agreement yet binds Atlas to Turf Point. That is normal at this stage. The port owner has strong reasons to sign, and failure to sign strikes me as very unlikely. But it remains the key binary item of the setup. I treat it in detail in the risks section.
The rest is already in place. The St. George’s substation sits 1.4 kilometers from the project, the Trans-Canada Highway runs alongside it, and a regional airport is within reach. Atlas essentially bolts a shallow, laterally continuous salt deposit onto road, power, and air infrastructure that someone else built decades ago.
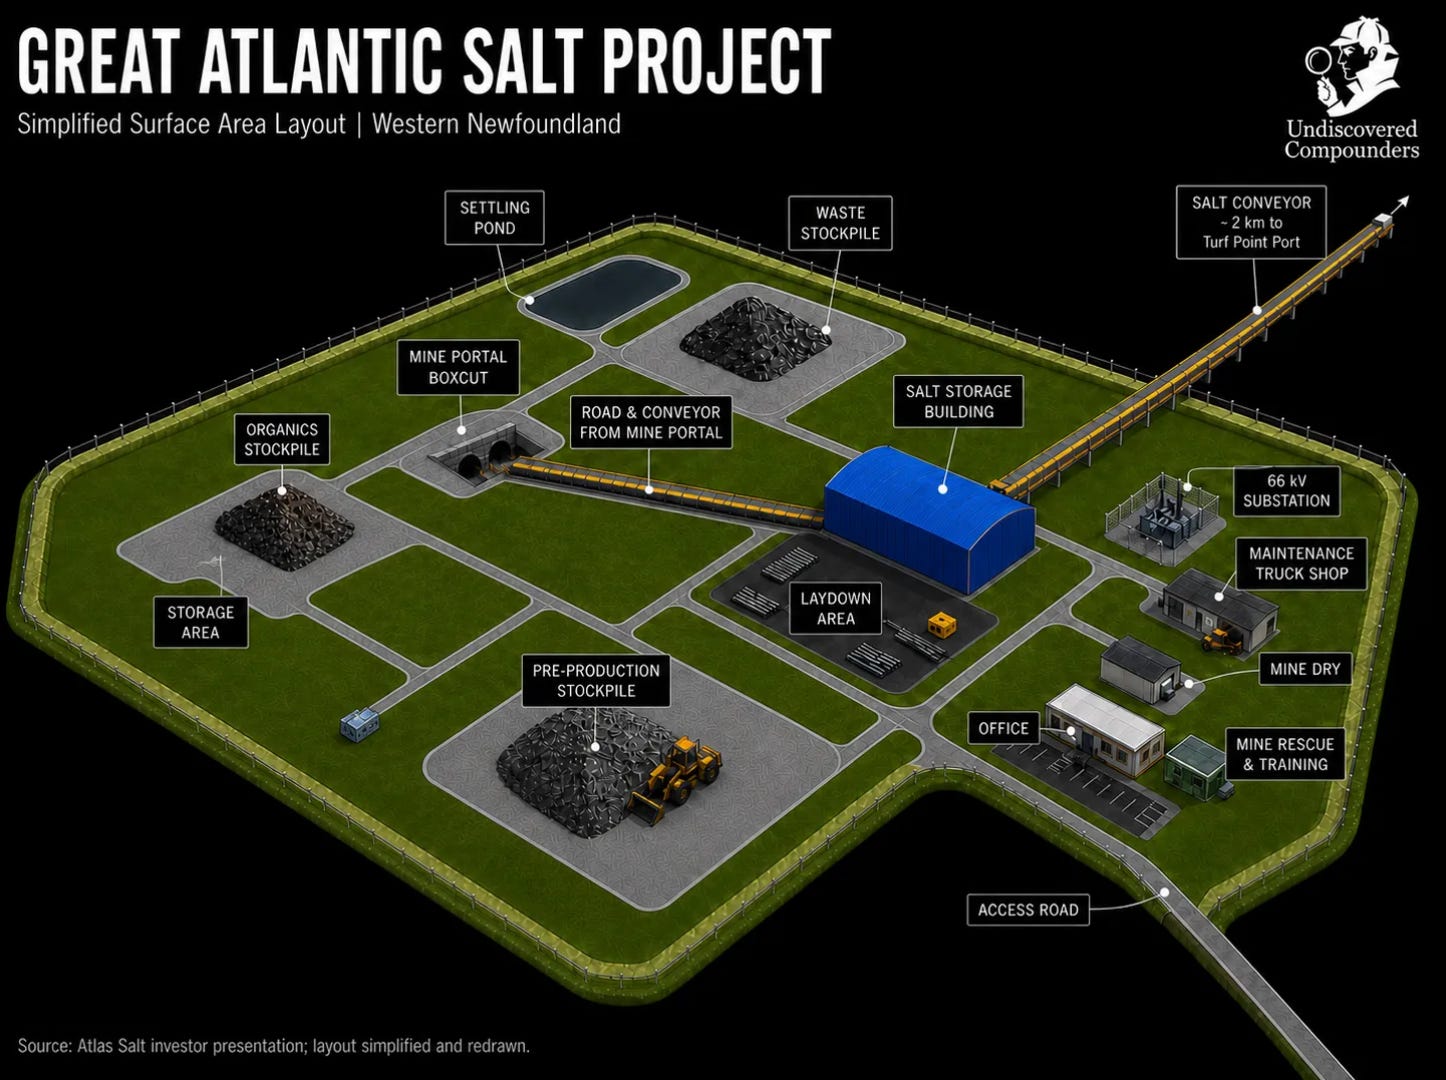
The Operational Design
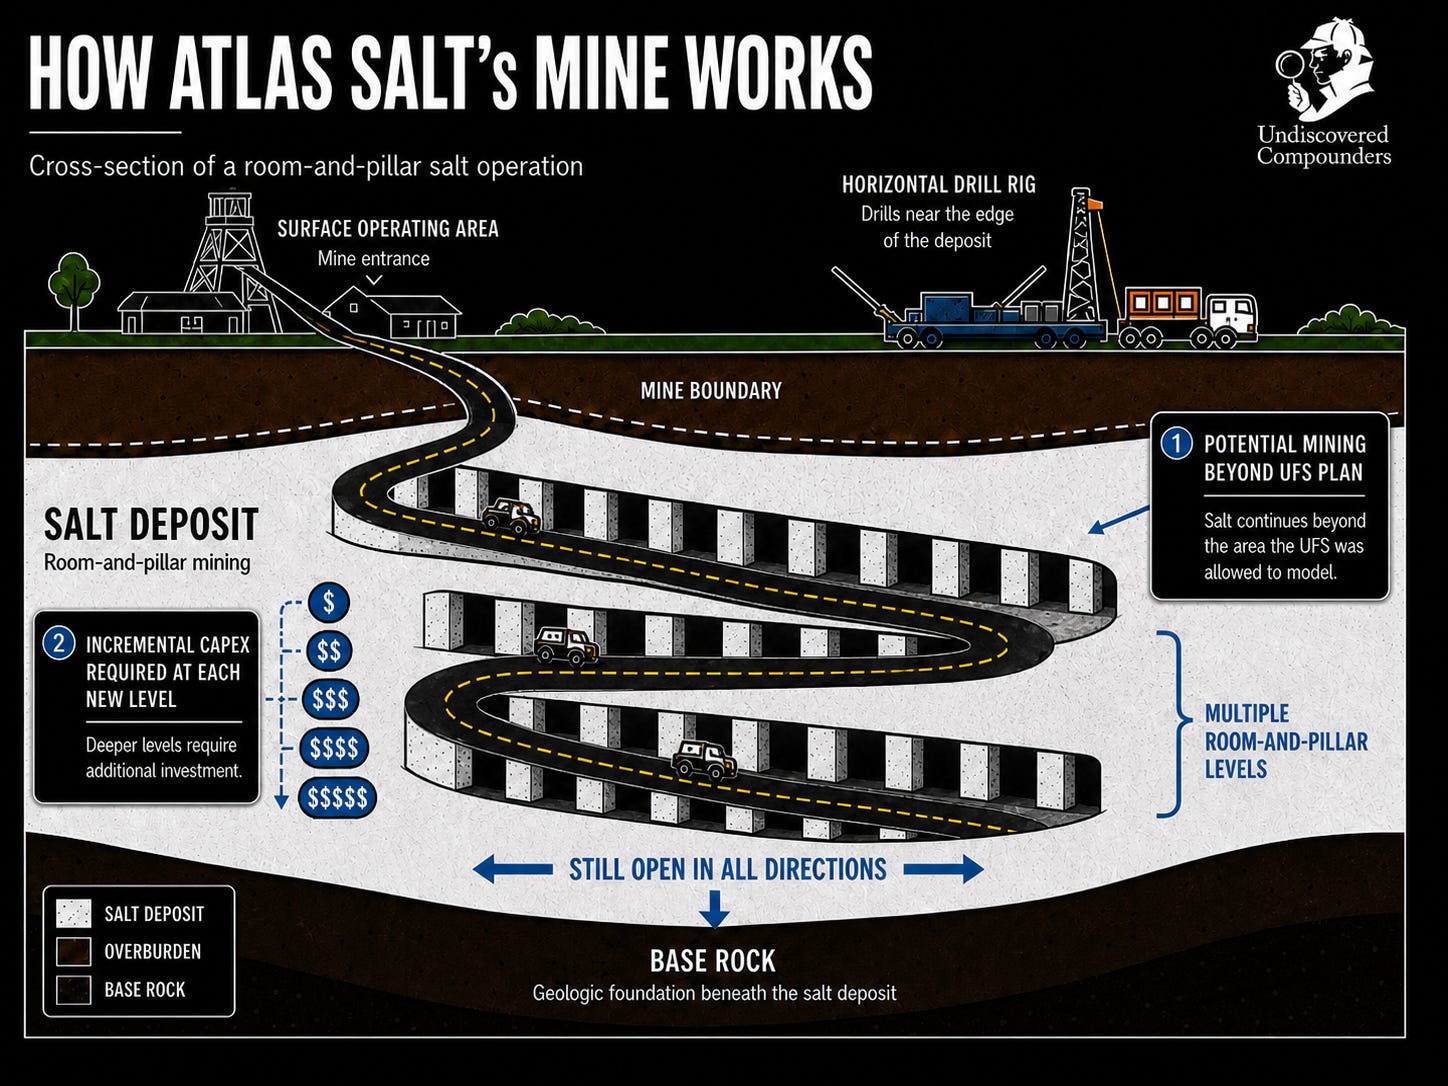
Goderich’s mine sits at 550 meters. Cayuga’s, beyond 700 m. Great Atlantic’s is around 180 m. A third of the depth changes the entire economics of the project.
A deep mine needs a vertical shaft: a cage to lower crews, a hoist to lift ore in skips, several years of construction and several hundred million dollars before the first tonne reaches the surface. Atlas can skip that shaft-and-hoist architecture. At 180 meters, the gradient is gentle enough to drive declines that run from the surface down to the orebody. Trucks, conveyors, and personnel can move through ramps (and gravity) instead of relying on a vertical shaft.
The geometry pays a second time. Once underground, you attack the rock. The chosen method is room-and-pillar: you carve a grid of rooms into the salt, leaving pillars of salt untouched between them. The salt mostly holds itself up; that is the point of leaving pillars behind. The method works best on tabular, thick, homogeneous deposits, which is exactly what Great Atlantic is.
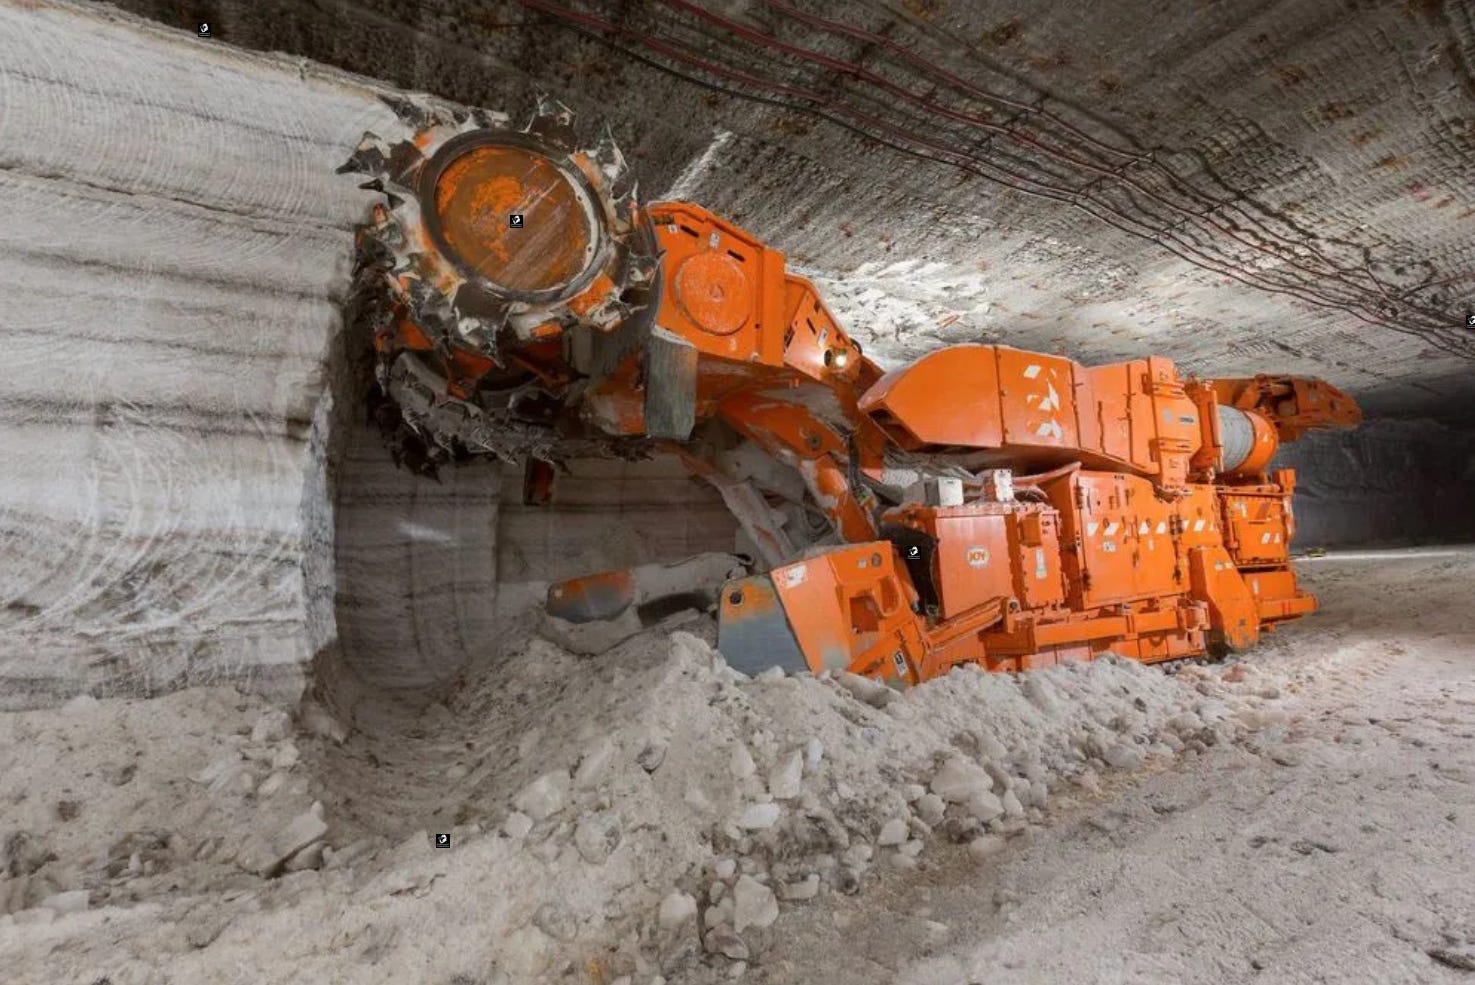
Then you have to break the rock. Most underground hard-rock operations still use drill-and-blast: drill holes, pack explosives, fire, clear debris, ventilate and repeat. Atlas chose a continuous miner, a machine that bites into the rock with a rotating head and drops it onto a haulage system. Salt is soft compared to granite or metallic ore, soft enough that mechanical cutting becomes the lower-cost option.
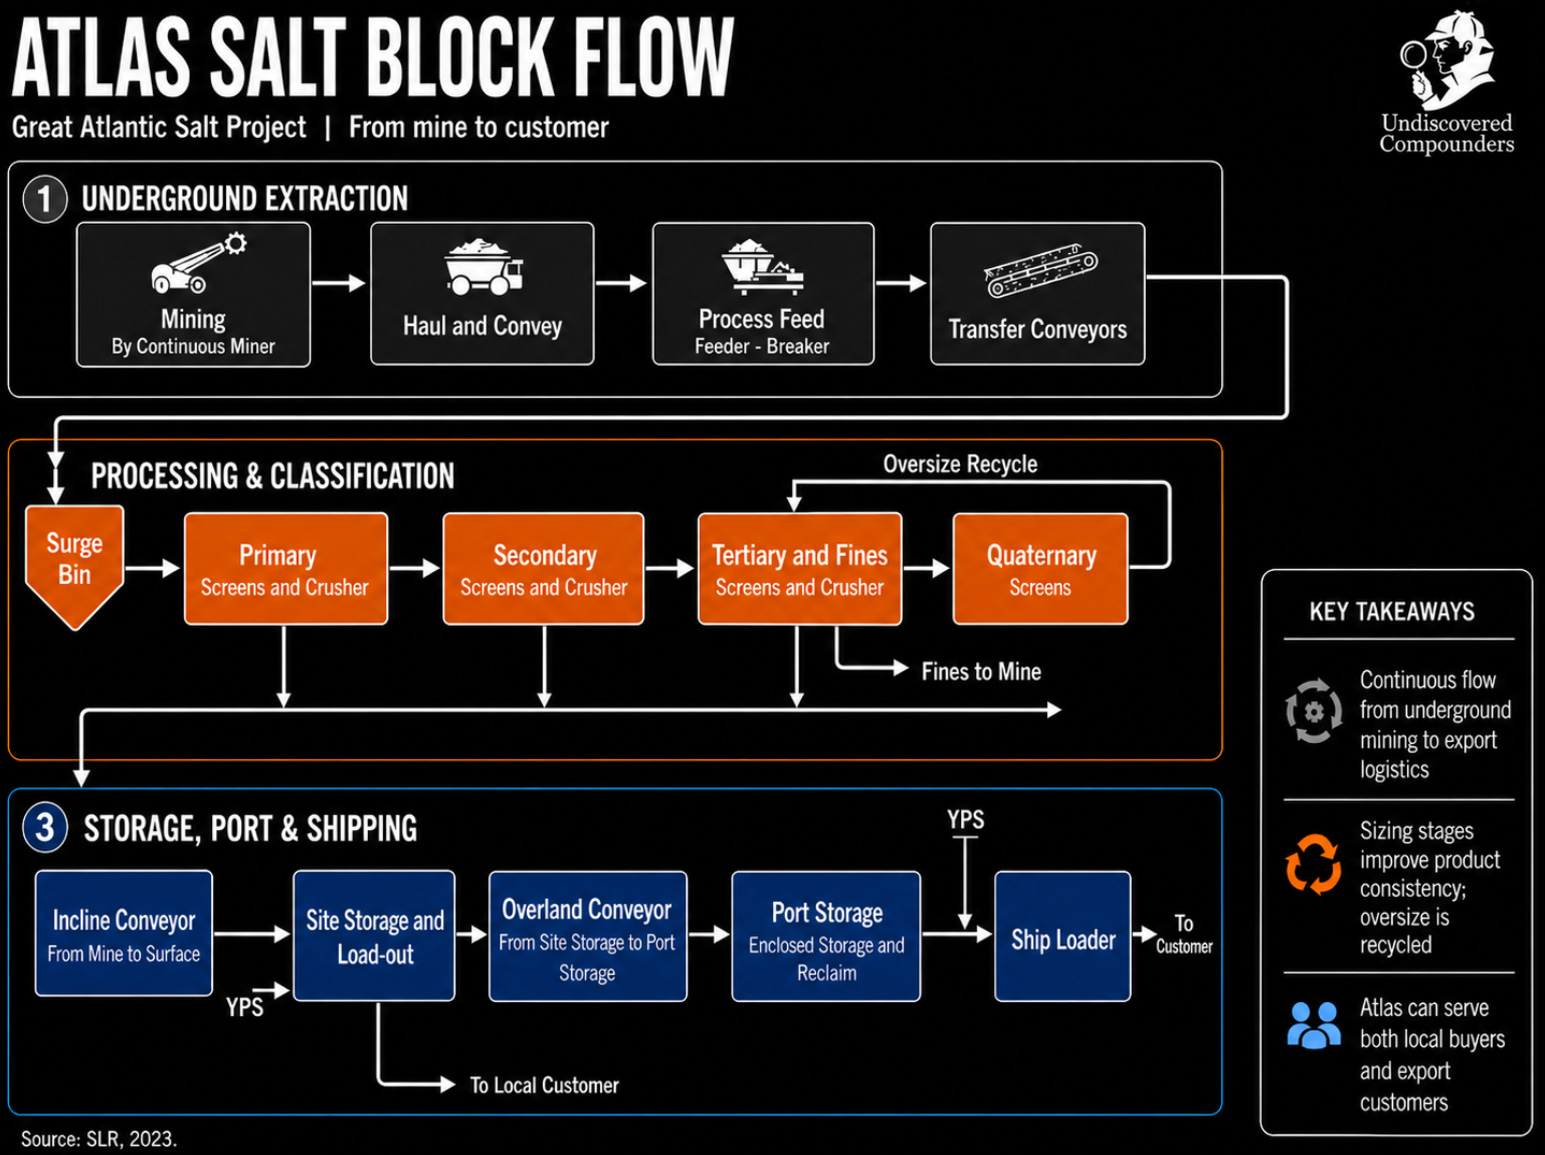
The rest of the flowsheet is deliberately short. An underground crusher and screens size the salt. A conveyor carries it up the declines. At surface, it passes through a 47,300-tonne storage building. From there, a second conveyor carries it the two kilometers to Turf Point, where a dedicated storage and conveyor-fed shiploading system would load vessels for export. But even simplicity carries risks, and the project’s risk profile gets its own section.
In video form (please forgive the music):
Because the design avoids drill-and-blast and uses an electric underground fleet, the ventilation load falls sharply. Great, because ventilation is one of the largest energy line items in a conventional mine. That allows Atlas to design the site as an electric-based operation: electric cutting equipment, battery-electric underground trucks and loaders, power drawn from Newfoundland’s hydroelectric grid. The ESG case wrote itself, and it happened to align with exactly what the province and the local communities wanted to see from a new mine.
The design is not being invented from scratch. Great Atlantic Salt draws heavily on Irish Salt Mining’s Kilroot mine: an underground soft-rock room-and-pillar mine, with an underground conveyor system, and product moved to port for shipment into the deicing market. Atlas’s senior engineers visited Kilroot, and the Great Atlantic study team included engineers with Kilroot experience, especially on ground support, underground conveyor structure, and drift access design. That does not remove execution risk, but it does show that similar mine architecture has worked before. It is also worth noting that Kilroot was developed in the 1960s.
A shallow deposit, a continuous extraction method, a five-step flowsheet, and a conveyor that ends in a ship’s hold. On paper, the operation is about as simple as a salt mine gets. But on the ground, simplicity tends to end where people begin.
The Social Component
A mining project also stands on its ability to clear permits, hold community support, and present a defensible environmental profile.
This part is not necessarily riveting, but it matters. For those who really do not feel like reading it, let me summarize: on these three fronts, Atlas is not only moving without friction but is actively supported by both local stakeholders and the provincial government.
For the rest of you, let’s dissect.
Permitting
Seven weeks. That’s the time it took Newfoundland and Labrador (NL) to release Atlas from its environmental assessment process, from filing to clearance. For mining projects, that is fast. Full environmental assessment processes can run 12 to 18 months, and full environmental-impact-statement cases can stretch over several years. Those seven weeks tell you at least three things. Two are obvious: the file was clean, and the regulator wanted it through. The third is less obvious, and we will get to it when we talk about who runs this company.
At the federal level, the IAAC (Impact Assessment Agency of Canada) confirmed in writing in December 2023 that the project is not subject to a federal impact assessment. Salt mines are not on the list of designated activities, and 4 Mtpa of production does not trigger a designated-project review. Two levels of government and two green lights.
Several approvals and project plans are already in place66: EA, Early Works Development Plan, Environmental Protection Plan, Waste Management, Water Resource Management, Wetland Conservation, Bat Preventative Measures, Gender/Diversity/Equity/Inclusion Plan, and Benefits Plan. What’s left belongs to the construction phase: a separate Capital Development EPP (Environmental Protection Plan), a Mill Licence before operation, and potentially a Fisheries Act Authorization for the in-water works at Turf Point (dredging and new caisson). That last one is the only potential bottleneck, with an up to 18-month process if triggered, but the four-year execution schedule has room for it (I contacted management on this point, and on several others, but as of today I have not received a response). Incentives are aligned across all parties, which makes it unlikely to become a problem.
Jurisdiction and community
NL ranks third among Canadian jurisdictions for mining investment in the Fraser Institute’s 2025 survey, and fourteenth globally. The regulatory framework is stable, the provincial government actively courts mining capital, and the region around the project has an unbroken mining tradition since the 1950s: gypsum for decades (still shipping today), and a limestone mine still operating. St. George’s is not a town meeting its first mining project.
Three stakeholders have formally voiced support: the Town of St. George’s, the Bay St. George’s Chamber of Commerce, and the First Nations Bands of St. George’s, Flat Bay, and Three Rivers. The Qalipu First Nation67 is still considering its support, but has raised no specific concerns. The project site already sits next to an active gypsum quarry, and Qalipu’s administrative base is approximately 70 km away. The probability of friction appears low.
Environmental profile
Credible ESG arguments are rare in mining, but Atlas ticks several boxes that make the defense unusually easy. The mine is designed to be an electric operation, powered by NL Hydro’s hydroelectricity at C$0.062/kWh. Projected Scope 1 emissions: 79 tonnes CO2 per year (approximately what four 4-person households in Newfoundland emit). No tailings, no chemical processing, and no diesel underground fleet. The project’s carbon footprint is a rounding error on a suburb. That helps explain why the environmental assessment approval was granted in less than two months, compared with approximately 1-1.5 years for other mining projects.
Sensitive-species on site? Only one issue has shown up in surveys so far. Bat acoustic monitoring picked up activity in July 2024, with follow-up results still pending. At this stage, that looks like routine procedural work, more likely a small cost line than a thesis risk. Black ash and raptor surveys turned up nothing. No known archaeological sites either.
Now the best “incentive” part: the projected economic return to the community is enormous: 170+ direct long-term jobs, nearly C$2.8 billion in tax revenue over the mine’s life, and active support for Memorial University’s critical minerals research. St. George’s is a rural community whose population declined 5.3% over five years and it is about to inherit a multi-generational employer.
Aligned incentives are rare in mining. It is one of the reasons even projects with exceptional numbers on paper, technically de-risked, stay undervalued for years. They die in the maze of permitting, opposing incentives, and community opposition. Atlas sits outside that maze. And yet it trades at a deeper discount than many projects stuck inside it.
04. The Business Model
Compass Minerals, one of the biggest deicing salt producers in North America, owns and controls: mines, packaging plants, distribution centers, brand names, storage depots, vessels, barges, rail and trucking relationships, and direct contractual relationships with virtually every DOT and public-sector buyer East of the Mississippi. Morton Salt and Cargill have built the same end-to-end machine. They mine the salt, screen it, bag it, brand it, ship it, and sell it directly to the entity that will spread it on a road. These are fully integrated supply chains built over 60 to 130 years.
Atlas controls a planned mine project that is expected to start production in 2030.68
This section is an analysis of what that gap means.
One clarification upfront. As of the date of this report, Atlas has not signed a single binding commercial contract with any relevant counterparty. The key commercial relationships disclosed by management so far are non-binding MOUs (Memoranda of Understanding). Early works are underway on site, but remaining construction-phase permits, project debt, and equity gap funding are still ahead. First production is at least four years away under the schedule disclosed by management. This contractual posture is the normal state for a junior developer at this stage, and it is the starting point from which the rest of this section should be read.
The Product: One Feedstock, Several Commercial Formats
Atlas plans to sell essentially one feedstock: crushed rock salt for road deicing. The same raw material comes off the crusher, then gets separated into different specifications and formats depending on the sales channel, but not in equal proportions. Within the bulk road-salt segment, the UFS distinguishes two commercial specifications coming off the same crusher. Public road-salt tenders typically require the ASTM D632-12 standard.69 Commercial products sold through distributors demand tighter “Screened Mediums” specifications: the same 95% NaCl minimum, but lower moisture, narrower gradation, and fewer fines.70 The two streams would be separated at the processing plant: Atlas produces one product and screens it into commercial grades depending on which sales channel it feeds.
A smaller share could go to packaged consumer salt, sold through branded partners such as Scotwood Industries, the segment where Atlas could capture a meaningful piece of the approximately 6x markup that exists between bulk producer pricing and retail shelf pricing. A marginal residual goes to colored salt for specialty markets, irrelevant to this analysis and not contractually committed in any case.71
Where Atlas Plans to Sell
The planned 4.0 Mtpa production splits across four geographic destinations, each with its own logistics profile and pricing dynamics.
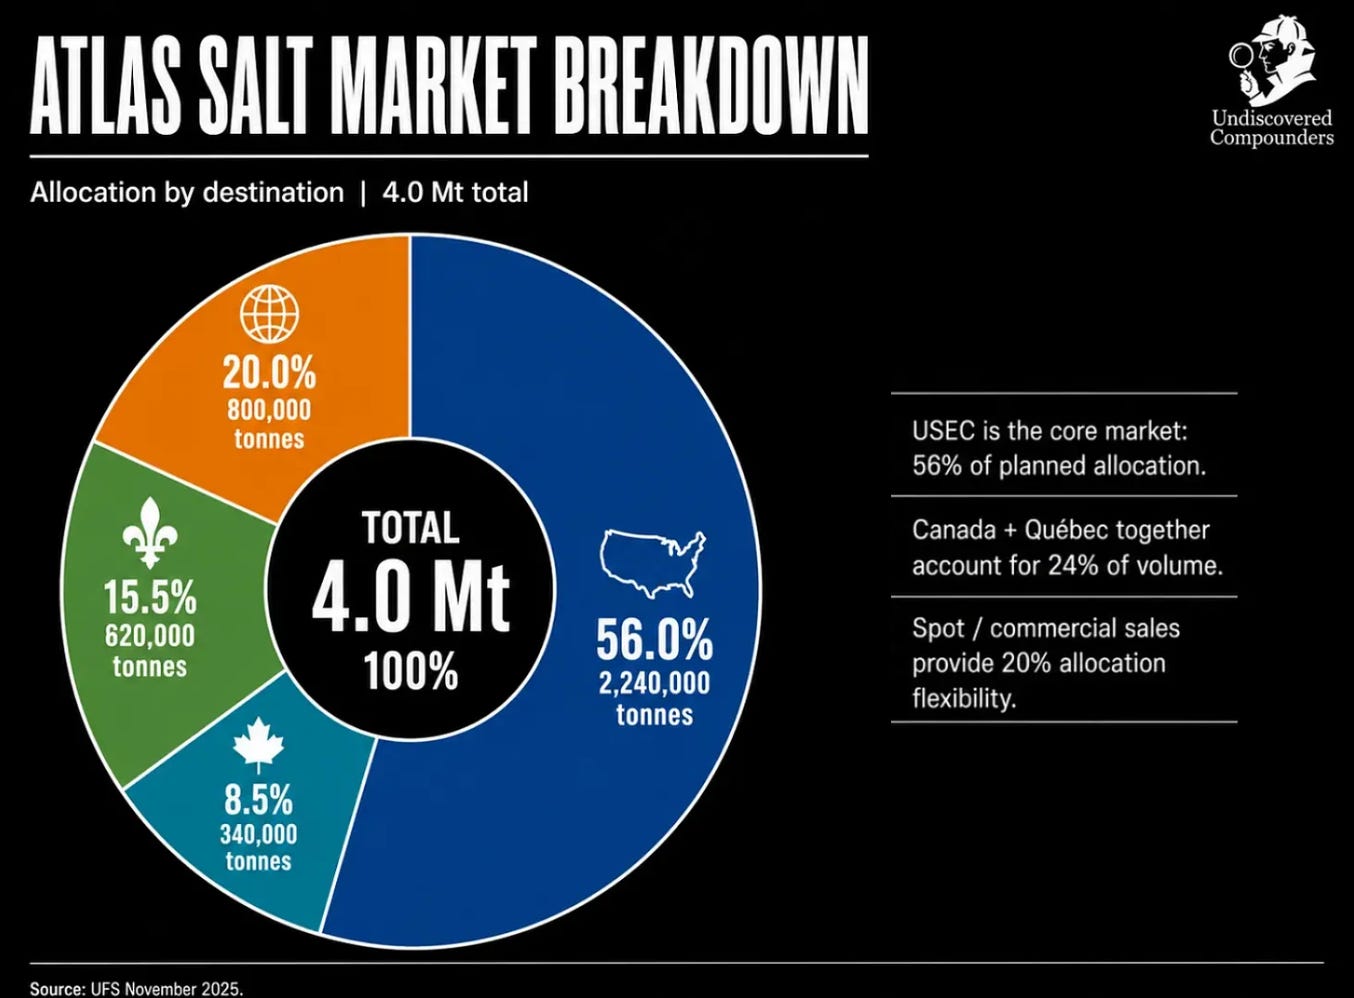
The U.S. East Coast represents 56% of planned volume and the bulk of the C$920M NPV. The UFS defines this market as ports along the U.S. East Coast from Maine down to Baltimore, plus inland states reaching as far west as Pennsylvania and West Virginia. This is the region where the 8-10 Mtpa structural import gap concentrates, and where Cargill’s permanent closure of Avery Island in 2022 removed another 2.5 Mtpa of domestic supply from the market. Realistically, 1.5 to 2.5 Mtpa could land somewhere along this coast, displacing the highest delivered-cost suppliers first: Chilean and Egyptian salt with multi-week ocean lead times, but also North American mines whose distance from the East Coast forces freight costs that Atlas’s geographic position simply does not carry.
Québec, at 15.5%, is the defensive line. The St. Lawrence corridor consumes an estimated 3.5 to 5 Mtpa every year, and for ten weeks each winter, Atlas would be one of the few nearby producers with waterborne access into the region while the Seaway is closed. As noted, the 15.5% allocation is not committed. But no new commercial infrastructure is needed to capture it: the corridor is already there, the buyers are already there, and the geography does the rest.
The Maritimes (Nova Scotia, New Brunswick, and Prince Edward Island) at 8.5%, is a smaller target, and a relatively standard one. Atlas would sell salt dockside at ports like Halifax or Saint John, and a local distribution company would handle unloading, storage, and delivery to the final customer. For those provinces, Atlas would become a nearby, reliable source they can tap in volume and during the season. For Atlas, it is a minor share of output with above-average margins. Geography, yet again, tilts the economics.
The 20% allocated to Spot Sales and Commercial is the most economically interesting line in the mix. It captures three distinct flows. First, emergency purchases by municipalities when their contracts run short (the Ontario 2026 dynamic, with spot prices at C$300/tonne). Second, ongoing sales through commercial distributors to private snow contractors, who get pushed to the back of the queue every time municipal demand spikes and end up paying multiples of normal bulk pricing. Third, the local Newfoundland market itself, approximately 0.3-0.35 Mtpa with no internal production, served by truck and short-haul vessel shipments directly to municipalities along the west coast. All three flows pay above tender pricing. And all three favour the producer who can ship year-round.
I’ll say it again: this is a planning allocation by design, and a deliberately conservative one. Atlas appears to want a larger spot-market allocation than the UFS assumes. As a shareholder, I would welcome that (more on that later).
How It Actually Sells: CIF, DAP, FOB
There are three commercial structures, depending on the destination. Each transfers risk and captures margin differently.
CIF (Cost, Insurance, Freight) is the standard structure for the bulk of U.S. East Coast shipments. Atlas would arrange and pay for ocean freight and insurance to the destination port, where a local distribution company manages unloading, storage, trucking to the salt depot, and final sale to the road-spreading entity. Atlas would carry the freight-cost exposure; the distributor would carry everything downstream. This is the dominant structure for the 56% U.S. East Coast allocation.
DAP (Delivered at Place) applies to the western Newfoundland market. Atlas would deliver all the way to the customer (typically a municipality) by truck or short-haul vessel depending on distance. Atlas would control the entire chain to final delivery, but the addressable market is small. Management has not named carriers or routes, but the economics point to contracted trucking rather than an owned fleet (at least in the early production years). At 0.3-0.35 Mtpa, the volume does not justify dedicated vehicle CapEx.
FOB (Free on Board) applies to buyers who arrange their own vessel at Turf Point and take title once the cargo is loaded. Atlas’s risk ends once the salt is loaded aboard the vessel. This is the simplest structure for Atlas operationally, but it can limit pricing power: the buyer’s negotiating leverage is highest when they control the vessel.
I hope you’ve been following closely, because this is where it gets important. Section 19.4.2 of the UFS:
“Regardless of the shipping terms (DAP, FOB, CIF), the pricing assumed by SLR in the financial model is FOB Turf Point Port.”
The entire C$920M NPV runs on a uniform C$81.67 per tonne price on an FOB Turf Point basis, regardless of the commercial shipping terms. The assumption is simple and elegant. If anything goes wrong in the long-distance deicing salt chain (and plenty can), Atlas’s 2 km-to-port geography becomes structurally more valuable than the model assumes. Imported Chilean and Egyptian supply loses competitiveness first. Atlas keeps its relative position intact. The FOB-equivalent pricing assumption is therefore potentially a source of additional margin. Like the 288 Mt of additional Indicated Resources and 868 Mt of Inferred Resources earlier, I’m treating it as free upside. The setup still does not need it.
The Contracts
Section 19.5 of the NI 43-101 technical report captures the current situation perfectly:
“Atlas has had preliminary discussions with potential salt purchasers as well as salt brokers. Similarly, the Company has had preliminary discussions with logistics companies and port operators that would be involved in the process of delivering salt to destination markets. As of the effective date of the UFS, Atlas has not entered into any binding commercial contracts with respect to salt marketing or logistics.”
Nothing abnormal here. Early works on the mine have begun, production is at least four years away, and counterparties rarely commit to binding contracts that far ahead of execution. Atlas has already announced four non-binding MOUs (Memoranda of Understanding; statements of intent) with tier-one counterparties.
MOUs serve two purposes, depending on the counterparty: they can reduce the capital Atlas has to raise upfront, and they tell future lenders that a tier-one counterparty has already diligenced the file and stayed at the table. Take Sandvik. If that equipment MOU converts to binding vendor financing, Atlas could pay for the fleet out of post-production cash flow, not out of equity raised today at a depressed valuation. Each MOU has its own specifics, but the logic is the same: less potential dilution now and/or easier financing later.
Atlas currently has four such MOUs with major counterparties. Each is non-binding, but each is a potential milestone. Especially the first one.
Scotwood Industries, Commercial Offtake + Canadian JV (August 20, 2024)
Atlas signed the MOU thirteen months before the UFS was published. It bundles two things into one deal. First, a proposed strategic offtake: Atlas would supply bulk salt to the partnership. Second, a 50/50 joint venture: the JV packages that salt, brands it, and sells it into the Canadian retail market. A combined target of 1.25 to 1.5 Mtpa, with profits split equally after each side recovers its costs. The deal explicitly excludes bulk road deicing salt (the public-tender channel) and excludes the four Atlantic provinces (the market Atlas can reach on its own). With one important exception: Scotwood’s national Canadian retail accounts (think Walmart Canada, Home Depot Canada) can be supplied anywhere in the country, including the excluded provinces. Remember, this is the channel where the same salt can sell for several times the bulk price.

Why this matters.
Scotwood is the largest packaged retail deicing distributor in the United States: Home Depot, Walmart, big-box mass merchandisers, DIY chains, farm and home retailers, grocery chains, and others. When a distributor that size signs even a non-binding MOU with a junior pre-production developer, the file has passed a filter. Chase Wilson, Scotwood’s President, said so at signing:
“Being the largest distributor of packaged retail deicing salt in the United States we are very selective in choosing new business partners. If completed, we believe Atlas Salt’s long life underground salt project would make Atlas Salt an ideal long-term partner for us in Canada.”
Rick LaBelle, then CEO of Atlas Salt, was equally explicit about Atlas’s side of the logic:
“Since I joined the Company, I’ve been focused on opportunities in the retail market, where supply is more predictable, and margins are generally higher.”
This is where the UFS NPV stops being the full picture.
Every tonne in the C$920M NPV starts from a C$81.67 per tonne base price on an FOB Turf Point basis. SLR chose a single blended price across every destination and every product format, effectively anchored on bulk deicing economics (the lowest-margin channel in the deicing market). Walk into a Home Depot today and look at the shelf: a tonne of packaged deicing salt retails around C$500-600. The UFS prices essentially none of this differential.
Most of that retail spread won’t flow back to Atlas: retailer margin, distribution costs, packaging, and the 50/50 JV split with Scotwood all take their cut. What lands on Atlas’s income statement after those steps could be somewhere between C$60 and C$80 /t above the bulk base case (estimate),72 depending on cost structure and negotiation. At 1.5 Mtpa through Scotwood, that’s C$90 to C$120 million of incremental annual pre-tax contribution attributable to Atlas not captured in the NPV. Discounted at 8%, with no salt-price escalation, over the 24-year mine life, the C$60-80/t uplift on 1.5 Mtpa would imply approximately C$945 million to C$1.26 billion of pre-tax present value.
After taxes and leakage, the incremental present value would land closer to C$630 million to C$840 million.
Let me reframe this. With up to 37.5% of annual production routed through packaged/retail-related channels, the incremental value alone could approach the entire NPV built on bulk pricing. Recalculating the NPV with 37.5% flowing through the packaged/retail-related channel (the high end of what the MOU contemplates) would lift project value by 68% to 91%. Cut that estimate in half as a safety margin and the uplift still lands between 34% and 45%. Just from Atlas selling its salt in bags through a partnership. Back-of-envelope, but the direction is unambiguous. And the company trades at a P/NPV of approximately 0.13x against a project NPV that does not count any of it.
That was the picture at 1.25-1.5 Mtpa. Then the project scaled.
The 2023 Feasibility Study modeled 2.5 Mtpa. The 2025 UFS modeled 4.0 Mtpa. Yet the Scotwood target volume did not move. Yet. Nolan Peterson, who took over from LaBelle in June 2025, addressed this directly:
“For Scotwood, that tonnage was set in the original feasibility study, remember when the project was much smaller. So there is the opportunity to expand that offtake to encompass the larger project production, and we are in discussions with Scotwood and other offtake partners about taking the remainder.”
Management has begun the conversation to expand that offtake, and Peterson’s phrasing (“Scotwood and other offtake partners”) telegraphs that the search has widened. If the binding arrangement eventually routes closer to 50% of nameplate through higher-margin packaged/retail-related channels, the economics per tonne attributable to Atlas could reshape the project entirely.
Peterson added one more line worth hearing:
“It does not mean that we need a partnership like this. We can always develop those relationships ourselves and market the salt ourselves, but it’s very helpful. It’s one less thing for us as miners that are familiar with mining and developing projects that we have to worry about.”
The CEO makes the point explicit: the MOU is not on the critical path. Atlas can walk away from it if the terms do not evolve in its favor. But the shortcut is worth taking, in my opinion, even on less favorable terms. Replicating Scotwood’s retail chain would take Atlas years and a lot of capital, starting after first production, with management bandwidth it does not have today and won’t have at the start of production. Owning the full margin sounds better on a slide, but getting half of it, years earlier, without the CapEx, is probably the better trade. At least through the first debt-repayment window, until cash flow stabilizes. In any case, senior lenders would probably reject a go-it-alone retail buildout. When project lenders underwrite a project, they do it against a specific base case, and they are usually reluctant to accept deviations, especially ones that introduce that much commercial risk.
The NPV holds up fine if Scotwood goes nowhere. The stock could reprice materially if it does. That’s the kind of asymmetry a shareholder wants to own. It shows up, to a smaller degree, in the three MOUs that follow.
Sandvik Mining, Equipment + Vendor Financing (September 2024, expanded February 13, 2026)
The Sandvik MOU, expanded in February 2026, is also the kind of thing we want to see as shareholders. The expanded scope raised the total estimated commercial value from C$73 million to up to approximately C$132 million, covering both initial construction and the multi-year ramp-up to 4.0 Mtpa. Sandvik would supply underground mobile mining equipment, technology, and associated services.73 Sandvik is also Atlas’s Integrated Project Delivery (IPD) partner, which means it would be embedded in the mine design, automation planning, and long-term maintenance architecture from the start.
The financing piece is critical (and easy to misread). It contemplates vendor-supported financing for Sandvik capital equipment within the C$132M commercial scope, potentially less than the full amount, subject to “customary due diligence, receipt of Sandvik’s required internal approvals, and negotiation and execution of the definitive agreements.” It is an expression of intent from a tier-one global equipment supplier that, if converted, could materially reduce Atlas’s upfront cash equipment outlay. If not, Atlas would need to find another partner, or fund the equipment from project debt or equity. We come back to this in the financing section.
Hatch Ltd., Lead Engineering & IPD Partner (November 12, 2025)
Hatch is one of the world’s largest engineering firms (10,000 staff, 150+ countries, over seven decades of engineering experience and a track record in underground soft-rock mines), with an established Newfoundland and Labrador presence. The MOU establishes Hatch as Lead Engineering Partner and IPD Partner. In plain English: Hatch would integrate all engineering disciplines under a single delivery framework, from detailed design through construction support.
The value of the Hatch relationship to Atlas is reputational as much as technical. A tier-one engineering firm putting its name on the project would signal to lenders and equity investors that the technical foundation is being built to institutional standards. For a junior developer with limited internal engineering depth, this matters.
Continental Conveyor, Material Handling, IPD Partner (October 29, 2025)
This is the most operationally specific of the four. Continental would design and supply the complete material handling conveyor package: 28 belt conveyors and head chutes spanning underground crushing, surface storage, the 2-kilometer overland conveyor to Turf Point, and the port loading systems. The equipment would be supported by Continental’s Canadian facilities in Thetford Mines, Quebec, and Napanee, Ontario.
The conveyor system is a critical-path item for the project (without it, neither the mine-to-surface flow nor the surface-to-port flow exists), so lining up a credible Canadian supplier early is operationally sensible.
The four MOUs are straightforward:
Scotwood Industries: Packaged retail offtake + 50/50 Canadian JV. 1.25-1.5 Mtpa. No vendor financing.
Sandvik Mining: Underground mobile mining equipment, technology, and services (commercial scope up to C$132M). Vendor financing contemplated.
Hatch Ltd.: Lead Engineering Partner and IPD Partner. No vendor financing.
Continental Conveyor: 28 belt conveyors, mine-to-port. No vendor financing disclosed.
Reading the four MOUs together leads to three remarks.
First, Atlas has assembled four tier-one counterparties, and Sandvik alone could address up to approximately 22% of the C$589.1 million initial capital cost if signed. This is important for a reason that sits at the core of this thesis: Atlas is, in my view, clearly undervalued today. As long as that discount to intrinsic value persists, minimizing dilution is directly aligned with shareholder interests. Binding contracts are what we want, but at the right time. For now, every MOU signed with a credible partner is a small incremental positive.
Second, the pace tells a story. The MOUs accelerated once the permits came through. Early Works commenced in February 2026 and will likely run at least through year-end. That gives Atlas time to secure additional MOUs and to begin converting project-delivery agreements (Hatch and Continental) into binding contracts.
Third, the four MOUs cover a range of construction-side workstreams, but on the production side, coverage is thin. Only Scotwood addresses offtake, targeting 31-37.5% of planned volume. At least part of the remaining 62.5-69% is actively in play: Peterson confirmed that discussions are underway with Scotwood to expand the original volume and with other retail offtake partners to cover additional production. We are still four years from first production, so there is runway. For the bulk side, finding buyers is the easy part. The market already imports because North American mines can’t produce enough. If Atlas shows up with a year-round source three days from Boston, the sale will probably write itself. The real prize would be a binding retail offtake, even on a limited volume: it would mean Atlas has locked in a channel where every tonne ships at margins not reflected in the current NPV.
05. Management and Alignment
In junior mining, a perfect deposit mismanaged becomes another orphan on the Lassonde curve. Atlas’s rock looks exceptional. Whether the team can match it matters more than any number in this deep dive.
I look at management in three steps: who the people are, what aligns them with shareholders, and what they have already delivered.
The Operators
Look at the Atlas team and you see two generations of mining executives stitched together on purpose: the older generation built the company, the younger generation is going to build the mine. Knowing where one hands off to the other tells you more about Atlas than any single resume.
Patrick Laracy, The Founder Who Stayed
Start with Laracy, because everything at Atlas eventually routes back to him. He is the founder of Vulcan Minerals (1995), the founder of what became Atlas Salt (2011), and the current Chairman of Atlas Salt and longtime head of Vulcan Minerals. He holds an LL.B. from the University of Calgary and a B.Sc. Hons. in geology from Memorial University. It is a rare combination of lawyer and P.Geo in one person, which means he can speak both the technical and legal languages of the project without translation. Over thirty years, he has leveraged more than C$100M of high-risk exploration spending into actual deposits in the ground, most of it in Newfoundland.
The job title understates what he does. He’s a node in the province’s mining establishment: Vice-Chairman of Mining Industry NL, director of the Newfoundland & Labrador Chamber of Mineral Resources, past president of the NL Explorationists Association. When the province thinks about mining, it thinks about people like him. When it thinks about rock salt specifically, there are not many people ahead of him in the queue.
Remember the EA registration that cleared the provincial process in seven weeks. The file was clean, yes. But a clean file submitted by a man who has been part of Newfoundland’s mining regulatory conversation for three decades was always more likely to get a fair hearing, fast. Those seven weeks are also a byproduct of Laracy’s network.
Rowland Howe, The Man Who Knows the Competition
Howe is the single most overlooked name on the deck, and in my opinion, one I think Atlas should put front and center. The investor presentation lists him as “Director” and “Salt industry veteran.” That word is doing a lot of work.
From 1995 to 2011, Rowland Howe ran Goderich (yes, the same mine I’ve been referencing since the first section). He inherited it, scaled it, and took it from 3.5 Mtpa to a record 7.5 Mtpa, making it the largest underground salt mine in the world.74 He stayed another six years in strategic engineering and project roles before retiring from Compass in 2016.75
In 2021, Laracy brought him out of retirement to serve as President of Atlas. Howe led the feasibility work through its critical years, then stepped back as the project crossed into execution. He is now a director, still close to the project, and still serves as President of the Goderich Port Management Corporation.
This is the person who knows Goderich’s cost structure, its labor dynamics, its vessel logistics, its failure modes, and its customer relationships from the inside, over more than two decades. For a would-be competitor to Goderich to recruit him is an information advantage that is difficult to quantify. But let me try anyway: a man who spent sixteen years running the industry’s flagship mine does not come out of retirement to sit on a board for a project he thinks is mediocre.
There’s an episode in the middle of that history worth naming. Between Howe stepping back and Peterson stepping in, Atlas had another CEO: Rick LaBelle, appointed in August 2023, departed in March 2025 by “mutual agreement,” after nineteen months. LaBelle came from Dumas Mining, where he had been President & CEO from 2017 to 2022; the same Dumas where Andrew Smith, Atlas’s current Project Director, had run the PMO. Smith arrived during that period and stayed when LaBelle left.
As usual with these exits, the full story never made it into the press release. You can read the departure positively or negatively; I won’t speculate. What matters for the thesis is the observable fact: the company has already survived one CEO transition without losing its operating bench. That helps bound the succession risk around Peterson. Speaking of which.
Nolan Peterson, The Executor
The ideal CEO for Atlas at this stage would be someone who has already built and brought a similar salt mine in North America into production. That person probably does not exist, because no comparable salt mine has been built on the continent in decades. The next best thing is someone who has crossed the feasibility-to-production bridge on other mines, understands both the engineering and the financing, and knows what goes wrong in the middle.
Peterson arrived as CEO and director in June 2025. MBA, CFA, P.Eng., PMP, twenty years across finance, operations, and mine development. On paper, the boxes are checked. Now in practice.
Peterson spent seven years at New Gold, straddling the line between engineering and corporate finance. He started on the technical side as Project Engineer on New Afton, a gold-copper underground mine in British Columbia that he helped construct and commission into production. From there, he helped advance both the Rainy River and Blackwater projects through their development stages. Then he crossed to the other side of the house: he joined New Gold’s finance group and led financial planning and analysis for the company, running the numbers behind the same kind of projects he had helped build.76
After New Gold, he joined TMAC Resources in senior finance management, working on the Hope Bay gold project in Nunavut until Agnico Eagle acquired it. Then he took the CEO seat at World Copper in April 2021, a PEA-stage77 copper developer with assets in Chile and Arizona. He grew the story, advanced the technical work, then resigned in November 2023 to “pursue other opportunities”. Nineteen months later, he surfaced at Atlas.
Since arriving in June 2025, Peterson has cleared the year-one checklist fast: the UFS delivered, three construction-side MOUs signed or expanded (Hatch, Continental, expanded Sandvik), C$8.7M raised, OTCQX uplisting secured (higher-tier U.S. OTC market, broader institutional visibility and liquidity for U.S.-based investors), and Early Works physically underway on site. No binding project-financing, offtake, or major construction contracts yet. The next milestones to watch are interim funding for early works, then the definitive project-financing package.
The Construction Bench
Below Peterson sits a team assembled over the last two years, with backgrounds that say one thing: we are here to build.
Robert Booth (VP Engineering & Construction): C$1.5B+ in mine builds at Newmont and Hudbay. Andrew Smith (Project Director & GM): C$500M+ in international mine-building contracts at Dumas. Jeffrey Kilborn (CFO): twenty years in mining finance, former Director & CFO of Canadian Gold Corp. And at the board level, Bob Kelly, appointed to the board in March 2025: 40 years in senior mining roles, construction-management work at Voisey’s Bay Nickel, including the hydromet demonstration plant, GM of Teck’s Duck Pond Mine in central Newfoundland, then VP responsible for health and safety across Teck’s operating sites, projects, exploration activities, and office locations. Kelly is the one who has actually run a producing mine in this province, and he’s a past President of the Canadian Institute of Mining’s Newfoundland Branch.
There is no exploration geologist running the operating team anymore. The people with those skills have done their job. What is left is a builder’s team staffed for a builder’s problem, even if the stock still trades like an exploration-stage one.
The Cap Table
The table below gives the starting denominator: 110.7 million basic shares, about 119.6 million fully diluted shares. The old warrant stack is gone; 2.85 million warrants at C$2.40 expired in 2025. What remains is a small broker-warrant line and a normal stock-comp pool for a junior developer entering the expensive part of the curve.
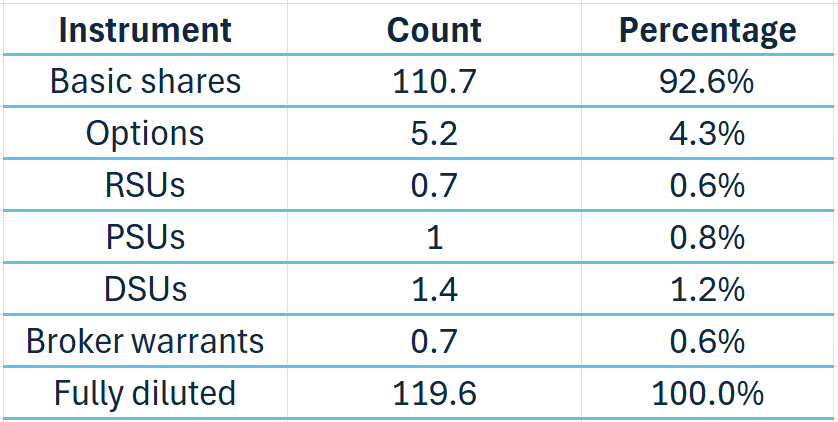
The existing dilution overhang is visible, but largely manageable. Options, RSUs, PSUs, and DSUs represent approximately 7.5% of the basic share count. Add broker warrants, and you get about 8%. This is almost nothing compared to the dilution risk during the construction financing phase.
On February 12, 2026, directors exercised 2.6 million options, and Atlas granted 3.15 million new options at C$0.98, including 1.6 million to directors according to the 2025 MD&A. Yes, the old options became shares, Atlas received cash, and the option pool increased by only 550,000 net. But this is basic retention, the company disclosed no link to project financing, construction start, first salt, or CapEx discipline. That is not catastrophic, the real incentive is still share ownership. But as a shareholder, I cannot see it as good compensation design, especially when the CEO still owns relatively little stock and the company is about to ask the market for construction capital.
Vulcan Minerals remains the anchor shareholder, with about 27.0% of Atlas at year-end 2025. Vulcan is led by Patrick Laracy and remains the main vehicle through which his influence is exercised. Laracy also holds approximately 5.3 million Atlas shares personally and through Triassic Properties. Put together, Vulcan’s stake and Laracy’s direct/related Atlas ownership represent around one-third of Atlas on a basic-share basis. Atlas has public shareholders, institutions, a board, and a new CEO, but Laracy is still the gravity in the room.
The rest of the board adds another layer of alignment. Edison holds about 1.3 million shares through Dollard Investments. Noel holds about 1.1 million. Howe owns 150,000 shares, plus his incentive package from his time as President. Peterson’s starting equity position was small, but he has bought approximately 50,000 shares in the market in 2026. Also worth noting: in the SEDI window I reviewed, over the last twelve months, I saw only insider purchases filed.
The structure is aligned, but still not entirely clean. Three of six directors (Laracy, Edison, and Noel) also sit on the Vulcan side of the table. That overlap is natural: Atlas came out of Vulcan, and the mineral rights, royalty, relationships, and institutional memory all run through the same corridor. But when the board votes on anything touching Vulcan’s interests, half the table has a seat on both sides.
The counterweight is Howe, Peterson, and Kelly. Howe knows the salt industry better than anyone else in the room, Peterson is the execution CEO, and Kelly brings Newfoundland operating credibility. My read is simple: Laracy controls Atlas in the practical sense. Through Vulcan, through his personal stake, through the board’s history, and through thirty years of weight in Newfoundland’s mining ecosystem. That is powerful when your interests are aligned with his. Less so when they are not. There is one specific case where this could matter: a potential M&A scenario. We will come back to it later.
The October 2025 financing added one powerful signal: Atlas brought in its first strategic investor. Management has not named the party, only described it as an investor whose interest in Atlas and Great Atlantic “aligns with its long-term strategic objectives.” I would not turn that into a takeover thesis, but someone with strategic interest wrote a cheque before project financing was in place. My take is that the strategic investor is more likely someone with a direct interest in securing future tonnes than a mine operator trying to fold Great Atlantic into its existing logistics network. Geography matters here, again. For most incumbent producers, Atlas is not an obvious plug-and-play asset, it is a new Atlantic supply point with its own route to market. The “obvious” candidate is Scotwood, given the MOU already signed with Atlas, but its strategic logic of owning equity is less obvious. The second bucket would be an East Coast port operator/distributor. Eastern Salt is the default name that comes to mind, although there are other possible candidates. Larger salt groups such as Kissner or Stone Canyon are also possible, especially if they want an early position ahead of a future M&A scenario, but a C$8.7 million LIFE financing would be a very small move for them. Possible, just not my base case at the moment.
Atlas has the right people, and enough ownership for alignment to matter. But Vulcan sits everywhere. That is acceptable while the goal is simple: get the mine built. It becomes less comfortable when Vulcan’s interests diverge from those of minority shareholders.
There is one case where this matters. Here it is.
The Royalty
In 2012, when Laracy spun the salt and industrial minerals business out of Vulcan into what was then called Red Moon Potash (later renamed Atlas Salt), the mineral licences were transferred from Vulcan to the new entity. The consideration came in two forms: common shares in the new company and a 3% Net Production Royalty (NPR) payable on production from the mineral licences, calculated on Atlas’s gross revenue less port charges, processing costs, and the NL Mining Tax. That was the price Atlas paid to get its own assets.
SLR has already modeled this royalty in the C$920M NPV, so it does not change the headline number. But it changes who receives each dollar, and the distribution of value is more lopsided than first appears.
Back-of-the-envelope, using the royalty formula in the UFS: the royalty base is approximately C$8.86B over the initial 24.25-year mine plan, or about C$365M per operating year on average. At 3%, that gives Vulcan about C$266M of undiscounted royalty cash flow before Vulcan-level tax. Discounted at 8% from the UFS effective date, with the four-year pre-production period and the UFS production ramp, the stream is worth about C$80M. That is just under 9% of Atlas’s C$920M after-tax project NPV.
But the royalty may have a ceiling, and that ceiling may be Scotwood. If Atlas signs a definitive agreement and the JV operates as contemplated, Atlas would, under the UFS pricing assumption, sell its salt FOB Turf Point at around C$82 per tonne. The JV would package it, distribute it, and sell it at retail. After costs, profits would be split 50/50 between Atlas and Scotwood. Atlas’s share could potentially be classified as investment income from the joint venture, not as revenue from the sale of salt. If so, it could fall outside the royalty base, assuming the final royalty and JV documents do not contain a look-through mechanism. In other words, every tonne routed through Scotwood, or any similar structure, could leave more value with Atlas shareholders than a tonne sold directly into the market.
What Laracy’s Alignment Means for Shareholders
Most of the time, Vulcan’s 27% stake and Laracy’s direct and related 4.8% stake mean his interests are aligned with shareholders’ interests. When Atlas re-rates, his net worth rises in lockstep. But in three specific cases, the interests can diverge.
Financing decisions. Vulcan has been diluted from 29.79% in 2023 to 27.02% at year-end 2025, and will dilute further through construction equity. Every dollar of equity Atlas raises from someone other than Vulcan is a dollar of dilution to his largest asset. His economic incentive is therefore to raise at the highest possible price, as late as possible, and only what is needed.
Acquisition scenarios. If a salt major or private equity player tried to buy Atlas, Laracy has two interests to weigh. Atlas shareholders want the highest takeout price per share. Vulcan wants that too, but also wants to preserve the 3% NPR through any change of control. Laracy’s board seat means the royalty won’t be traded away in a rush. Whether that protects Vulcan at our expense depends on whether preserving the NPR compresses the takeout premium an acquirer is willing to pay.
Spin-offs. In 2022, Atlas spun off Triple Point Resources, which holds Fischell’s Brook salt dome and other mineral claims 15 km south of Great Atlantic. Howe is currently listed by Triple Point as a Special Advisor. The spin-off was marketed as a bonus for Atlas shareholders, and maybe it is. The mechanics, however, follow a recognizable pattern: assets that once sat inside Atlas now sit in a separate entity, with its own cap table, its own management and advisers (Howe), and its own future financings that Atlas shareholders will not automatically participate in. Atlas retains a 14.4% equity stake in Triple Point, but no board representation. The “main” other assets still inside Atlas are the Ace Gypsum Project (historical gypsum mines at Flat Bay, 3 km southwest of Great Atlantic) and the Black Bay Nepheline Syenite Property (a surface occurrence of nepheline syenite in southern Labrador, with historical metallurgical work and minimal 2025 spend). Neither is material to the thesis.
The Net Read
This ownership-and-royalty structure is a double-edged sword, except one edge is razor-sharp and the other is dull.
The sharp edge cuts in shareholders’ favor. Laracy holds approximately a third of Atlas through Vulcan and personal/related holdings. Every re-rating flows directly into his balance sheet. Insider and related-party ownership exceeds 40%. Howe has his salt-industry reputation on the line in a way a detached board director does not. These people are highly incentivized to make Atlas work.
The dull edge comes after Atlas succeeds. The NPR is a life-of-licence claim on value, already netted out of the C$920M NPV and worth about 9% of pre-royalty modeled project value. The board has a Vulcan tilt (three of six directors sit on both boards), so a change-of-control scenario could be negotiated around the royalty as much as around equity.
This is a common setup in junior mining. You get a management team and a board that are genuinely strong for a company this size, and the structure is part of how they get paid for it: the royalty, the overlap, and the concentrated ownership. That’s the price of having Laracy’s network, Howe’s salt expertise, and Peterson’s execution experience.
06. A Quick Look at the Financial Statements
Before opening the statements, one accounting point needs to be killed immediately.
Great Atlantic sits on Atlas’s balance sheet inside C$16.7 million of mineral exploration and evaluation assets. The UFS gives the project a C$920 million after-tax NPV at 8%. Those two numbers look incompatible only if you ask accounting to do valuation work, which you should not do for a junior miner.
The C$16.7 million is mostly the accumulated cost trail of getting the asset portfolio to this point (licenses, geology, feasibility work, engineering, etc.). It generally goes up when Atlas spends more money on the assets, but not when the salt market tightens or when the UFS points to a stronger economic case.
So the financial statements only tell us how clean the balance sheet is, where the cash went, and how much runway Atlas has before the real financing decision arrives.
The Wrong Place to Look for Value
The income statement is the least useful page in Atlas’s accounts.
There is no producing mine yet, no operating revenue, and therefore no margin to analyze. Atlas recorded a net loss of C$3.71 million in 2025, almost identical to the C$3.68 million loss reported in 2024. It may look stable, but it is mostly irrelevant. At this stage, the P&L mostly measures the corporate cost of keeping a listed developer alive while the project moves from feasibility study toward production.
A few items are still worth pulling out:
Share-based compensation fell sharply, but that was mainly an equity-award cancellation/reversal effect tied to former executives and a former director.
The C$776,644 gain on Triple Point came from Atlas losing significant influence after Triple Point’s financing and no longer accounting for it as an “associate” under the equity method, which created an accounting gain without bringing any cash into the business.
On the cost side, the “office, consulting fees, and other” line increased, but the MD&A says nearly C$800,000 of that increase related to financing expenses (the cost of trying to assemble the next layer of capital).
Management and subcontractor fees rose as well, largely because Atlas paid a termination payment to a former executive.
So yes, Atlas lost money again in 2025. That is the burden of every pre-revenue developer. The balance sheet is already a little more interesting.
Balance Sheet Snapshot
At year-end 2025, Atlas had C$26.3 million of total assets, C$6.0 million of cash, C$6.6 million of positive working capital, and C$1.8 million of total liabilities. There is no project debt, no construction facility, and no off-balance-sheet arrangements. The liabilities are mostly trade payables, a small Business Development Bank of Canada (BDC) loan, a light-duty vehicle loan, a conditionally repayable Atlantic Canada Opportunities Agency (ACOA) contribution whose repayment begins after commercial production, and an asset retirement obligation tied to Ace Gypsum. In other words, nothing that changes the Great Atlantic financing equation.
The company is therefore still simple: Great Atlantic + cash + a few assets around the edges. Those edges are worth identifying, because they can otherwise make Atlas look more diversified than it really is.
The old Fischell’s Brook Salt Dome property was spun out into Triple Point in 2022. Atlas still owns a residual stake, valued at C$1.37 million at year-end, but its ownership fell to about 14.4% after Triple Point’s 2025 financing, and Atlas no longer accounts for it as an associate. Strategically, that asset has left the building.
The gypsum assets are small. Atlas owns the Flat Bay / Ace gypsum assets near St. George’s, including three mining leases, cumulative gypsum sales/proceeds of C$2.1 million, and Atlas has an agreement with Turf Point Resources (the same port group involved in the future rock salt logistics) under which gypsum or anhydrite may be mined and exported in 2026, with Atlas receiving a trivial per-tonne royalty.
Black Bay Nepheline is even further out. Atlas spent C$15,078 on the project in 2025, mentions “encouraging” historical metallurgy, and intends to complete additional work in 2026. That is option value in the strictest sense: present in the filings but absent from the investment case. Bay St. George General is smaller still, with C$48,239 of costs incurred to date and nothing spent in 2025.
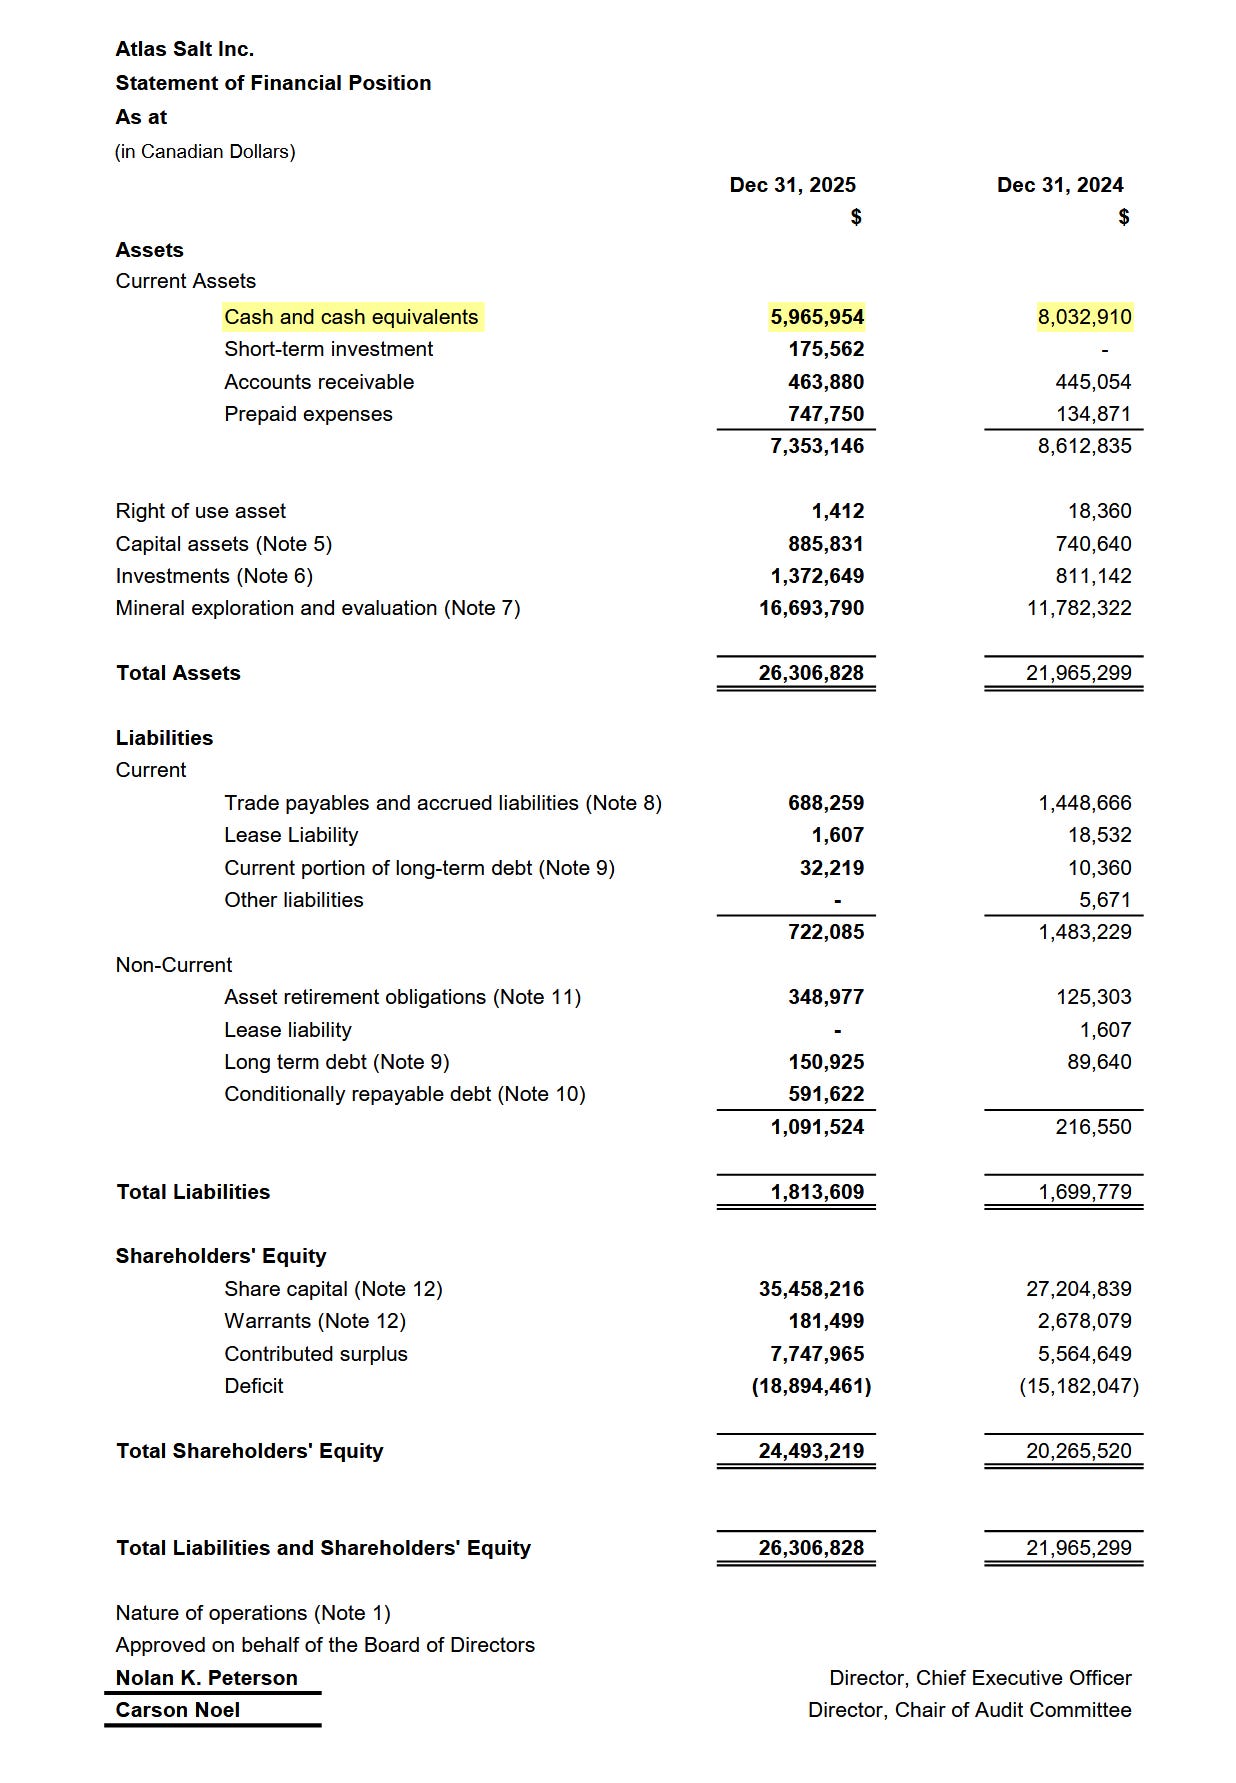
So far, none of this does much for the thesis. The same cannot be said of the cash analysis.
The Cash Question
Atlas raised money in 2025 and still ended the year with less cash than it started with. Welcome to the junior mining world.
Cash went from C$8.0 million to C$6.0 million. During the same year, the company raised C$8.6 million in cash through an equity financing, paid C$0.9 million of issuance costs, recorded C$0.6 million of conditionally repayable ACOA financing on the cash-flow statement, and still ended the year with C$2.1 million less cash. The financing basically covered the year, but the split gives us the useful information.
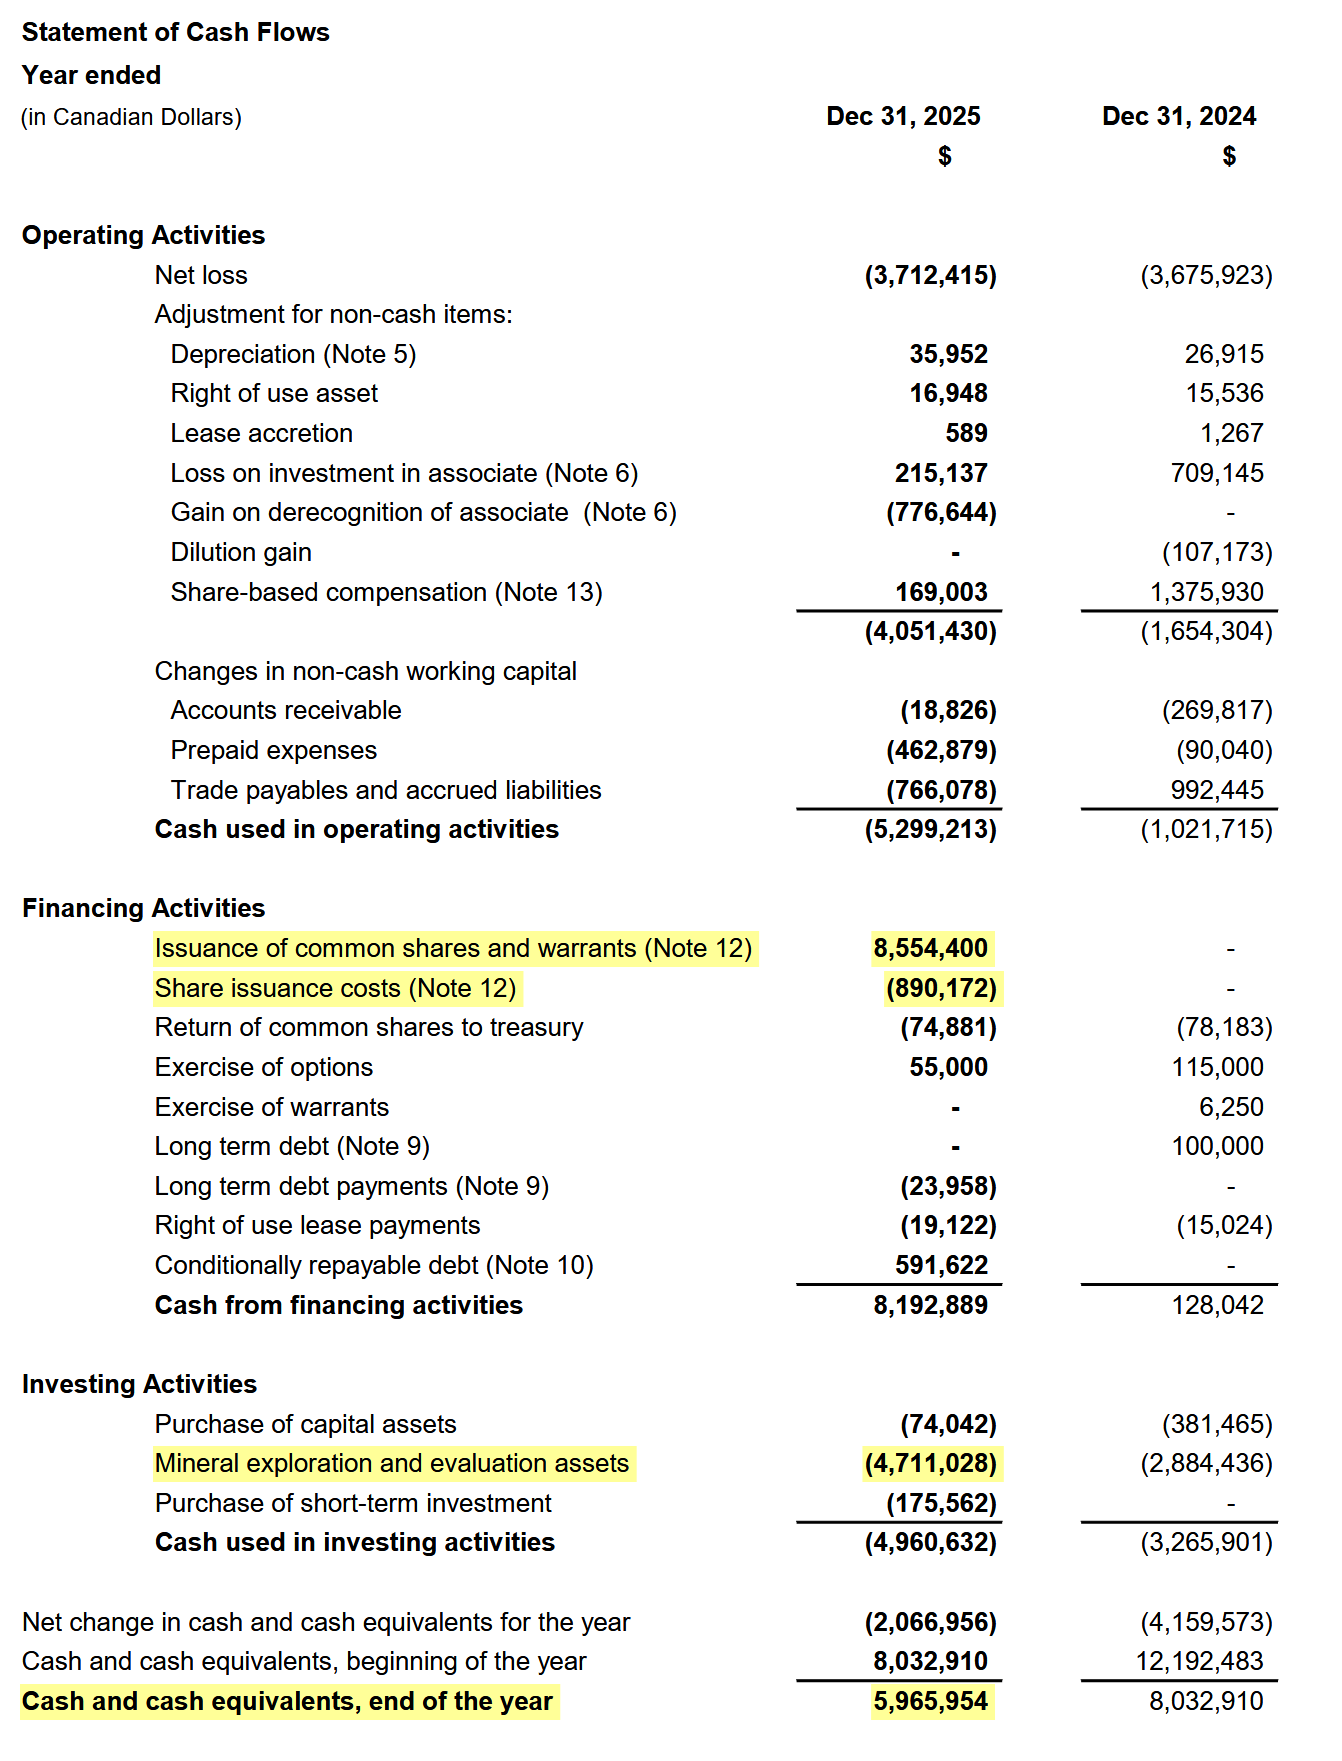
The investing line is the cleanest one. Atlas spent C$4.7 million in cash on mineral exploration and evaluation assets, and the carrying value of those assets increased from C$11.8 million to C$16.7 million. That is the part of the burn shareholders should want to see: money leaving the bank account and showing up in the project. I have seen too many junior miners slowly burn cash into another corporate appendix.
The operating line is less flattering. C$5.3 million of operating cash burn looks high for a company with no revenue. But it is also a dirty number. It includes: the cost of being public, a management transition, preparing a financing package, and cleaning up working capital. Prepaid expenses increased by C$0.46 million, trade payables and accrued liabilities fell by C$0.77 million, and the income statement itself contains non-cash noise from Triple Point and share-based compensation.
So saying “Atlas just burned C$10 million” is lazy at best. In 2025, the burn split into two buckets. Approximately half went into the asset, while the other half paid for the corporate and financing machinery required to move that asset toward construction.
That is what I want to see as a shareholder. A developer can spend very little and look disciplined while the project goes nowhere. Atlas spent real money. Some of it advanced Great Atlantic. Some of it was the toll paid to reach the next capital event.
The Next Step
C$6 million of cash at year-end left Atlas enough room to keep the file moving, but it does not build a mine.
This is why the going-concern language matters, but only if it is read properly. Management prepared the accounts on a going-concern basis, and the auditor did not include a material-uncertainty paragraph. That does not underwrite the future financing of the mine, or even the future salt tonnes themselves. It only says: Atlas has no revenue, burns cash, and had enough liquidity at year-end to keep operating for now. A perfect example of the difference between accounting reality and (economic) reality.
Same with the impairment work. MNP (the auditor) treated the assessment of impairment indicators for the C$16.7 million of mineral exploration and evaluation assets as a key audit matter, and no impairment indicators were identified. Fine. It removes a potential accounting red flag, one that was already obvious to anyone who did the work. But again, it does not bring the C$920 million after-tax NPV8 onto the balance sheet.
One post-year-end event is worth noting. On February 12, 2026, directors exercised 2.6 million stock options, adding cash to the balance sheet. The proceeds were not disclosed, but the year-end option table gives us a decent range. Based on the year-end option table, applying a C$0.79-0.89 weighted-average exercise-price range to 2.6 million exercised options would imply approximately C$2.0-2.3 million of cash, with the upper end probably the better proxy since the exercised options had to be exercisable. For simplicity, I assume the option-exercise proceeds have roughly offset the cash spent since year-end. That leaves Atlas with something close to C$6 million of cash in my current working estimate.
Audited statements make development stories look bad by nature. That is normal, that is their job, and probably for the better. The most positive thing they tell us is that Atlas is clean enough to keep moving for now, but they tell us nothing about how the mine gets financed.
That is the next question.
07. The Financing
No revenue, approximately C$6 million in cash, and hundreds of millions to raise or arrange over four years before the first tonne ships.
How Atlas closes that gap is the single most important question between here and production. It will shape what the existing shareholder actually owns in 2030.
Start with the cash need.
What Atlas needs to fund
Initial CapEx is C$589 million. That’s what SLR engineered and what every investor deck shows. But it is not the full amount of cash Atlas will have to fund between today and the first tonne is sold. Two categories sit at least partially outside the CapEx envelope:
Corporate overhead: C$12-16M. This is the cost of running a listed developer for another four years: corporate salaries, audit, listing fees, board, investor relations, etc. Atlas’s 2025 operating cash burn was C$5.3M, but that is too dirty to use as a clean run-rate: it includes management transition costs, financing expenses, and working-capital movements. A normalized figure closer to C$3-4M per year is more defensible. SLR covers approximately C$4.8M of this inside the CapEx envelope as “Corporate Costs,” but I will leave that buffer untouched. It can absorb slippage, extra advisory work, or the usual small costs that never look material until they aggregate. Four years of normalized overhead lands at C$12-16M outside the UFS capital estimate.
Working capital: C$10-20M. SLR explicitly excludes this from the CapEx estimate, and the UFS cash-flow schedule does not show a working-capital build either. It is the cash tied up in accounts receivable from customers who pay 30-45 days after delivery, finished product inventory, and operating consumables, net of accounts payable to suppliers. For a mine shipping 1.6 Mt in Year 1, or approximately C$131M of revenue at the Q3 2025 base price, C$15M as a central estimate is a standard order of magnitude. That C$15M should be recoverable at mine closure, but it has to be there as operations start to ramp.
Total funding need before financing costs: range of C$611-C$625M range. I use C$625M for safety.
Financing costs come on top of that, but they’re mechanically linked to how the financing gets structured. To size those, I need to lay out the debt architecture itself.
The Debt Architecture
The rock salt market and Great Atlantic’s features partly simplify the problem:
24 years of relatively predictable cash flows. The price of salt rises gently year over year on average, in contrast to gold or even copper, whose prices fluctuate far more.
An essential commodity with contractable demand.
Low, stable OpEx. C$28/t modeled LOM operating cost, with no metallurgical processing plant, no tailings, and a simple product.
These three features can unlock capital sources many junior miners can’t touch: infrastructure banks, export credit agencies, and even sovereign wealth funds. These lenders can look at Atlas as a quasi-infrastructure asset with contractable cash flows. Atlas will be financed. The question is how and at what price.
To that end, Atlas appointed Endeavour Financial (a London-based natural-resources financial advisor that has raised over US$4 billion in junior mining debt since 2003) as project finance advisor in December 2024. Endeavour has assembled the lender package: marketability of the salt, engineering, environmental and social diligence, and the UFS model. It is a single due diligence package sent to potential lenders, like a mortgage broker distributing one complete file to the market.78 Since then, Atlas has obtained two Letters of Interest (LOI) in hand from potential debt financiers, including export credit agencies. Nothing new here, the playbook already exists. Nouveau Monde Graphite secured a US$335M senior project-debt commitment letter;79 Canada Nickel, Torngat, Defense Metals, etc., show the same direction of travel80: Canadian resource developers are increasingly using EDC, CIB, ECAs, and strategic/public lenders to bridge the gap between feasibility and construction.
Nothing new, but nothing simple. Debt is a stack of layers, and each layer sits at a different level of risk and pays a different coupon.
Here’s how this capital stack could be structured, according to the CEO:
“60% of our financing [initial CapEx] needs from senior secured lending [...] When we figure that out, then we layer in the subordinate debt, 10 to 20% potentially [...] Also, the possibility of government support, and then of course the traditional equity angle.”
Three sentences that hide a lot of machinery. Let me unpack each layer.
Senior secured debt: about 60% of initial CapEx. First lien on the mine’s assets. The lenders would be specialized commercial lenders: they bank airports, power plants, ports, etc., and would be looking at Atlas the same way. Rates typically fall in the 6-8% range.81 Endeavour has been arranging this since December 2024. A common structure in these facilities is to roll the construction-period interest into the loan itself: instead of paying interest in cash during the four years when the mine generates no revenue, Atlas borrows the interest on top of the principal. Importantly, this does not necessarily increase the upfront equity cheque Atlas has to raise. The interest tranche can be structured inside the senior facility itself. It just enlarges the principal Atlas will repay once production begins.
Subordinate debt: 10-20% of the package. Second-lien or structurally junior capital, so it gets paid after senior lenders in a liquidation, which means it costs more. A lot more, rates are typically 10-15%. Debt is often structured as PIK (Payment-In-Kind) during construction, meaning interest is added to the principal rather than being paid in cash (with no drain on Atlas’s treasury until production). The natural providers would be resource credit funds that have seen every configuration of this structure: Orion Mine Finance, Nebari, Sprott Resource Lending.
Vendor financing: C$132M contemplated under the Sandvik MOU (potentially more). Sandvik signed an expanded MOU in February 2026, covering equipment and services through construction and ramp-up. The financing would likely be tied to Sandvik-supplied equipment, but the exact terms are not disclosed. This is the most clearly defined tranche of Atlas’s stack, but still a non-binding MOU.
Regarding the government support Peterson mentioned, I haven’t found anything concrete. Since I can’t quantify either the probability or the funding itself, I’m setting it aside. But I would be surprised if discussions were not already underway. If the government does end up providing construction financing, it would be really good news (as long as it is not the only lender in the room): interest rates would likely be low, and covenants could be lighter.82
Finally, we have all the axioms we need. We can now do the math.
The Cost of Financing
There’s no free lunch, so you have to pay the people who help you raise the debt and the equity. In the model, I assume senior debt fees of 1-3% of the facility size, subordinated-debt fees of 2.5-7%, equity issuance fees of 5-7%, and separate advisory/legal/closing costs of 1.5-3%. The exact figure depends on the equity residual, which depends on the total funds needed, which depends on the fees. But the final reality is unchanged: financing costs will be the largest cost item outside the UFS, by far. Every assumption and calculation is detailed in the DCF at the end and reflected in the valuation section.
There’s also a structural constraint: senior lenders control what can sit below them. They impose a set of financial covenants that govern how the rest of the financing can be structured:
Debt Service Coverage Ratio (DSCR). The ratio of cash flow available for debt service to scheduled debt service, commonly around 1.3x to 1.5x for contracted or lower-risk projects,83 with higher requirements when merchant or completion risk is higher. Depending on the facility, the test may apply to senior debt service only or to total debt service. Either way, every additional dollar of cash-pay subordinated debt tightens the equation.
Loan Life Coverage Ratio (LLCR). The NPV of future cash flows available for debt service over the loan life, divided by the relevant debt balance. Typically required at 1.5x to 2.0x.84 It is a longer-horizon coverage test used alongside DSCR. Same logic: more debt in the stack shrinks this ratio.
Gearing ratio. The ratio of total debt to total project capital. Usually capped at 70-80% for bankable infrastructure-like projects.85 Above that, the senior lenders can make closing very difficult.
These covenants are contractual: if Atlas tries to add subordinated debt that would push the DSCR below the threshold or the gearing above the cap, the senior lenders can use the intercreditor framework to block or condition the additional layer.
Peterson has said that resource funds have indicated they could push total debt to 70-80% via subordinate layers (vs. 60% senior), implying 10-20% of initial CapEx subordinate on top of the senior facility. The high end of that range is probably out of reach: the senior covenants (DSCR, LLCR, gearing) tighten as subordinate debt stacks up, and pushing to 20% would likely breach one of them. In my opinion, the realistic range is closer to 10-15% of the initial CapEx.
Fortunately for shareholders, Sandvik is different. Vendor financing is usually secured against the equipment itself, rather than sitting as another pure project-finance layer against the same collateral package. Depending on the structure, senior lenders may treat it as permitted equipment financing rather than standard project debt, but they will still care about the rest (repayment burden, liens, intercreditor terms, and cash-flow impact). Senior lenders may prefer vendor financing: it reduces the CapEx they have to cover directly, and it aligns the equipment supplier’s interests with the project.
I am going to spoil the valuation section a little, but it is necessary. In my model, the net construction-equity requirement ranges from C$125M to C$383M. I know the spread is wide, but I’m not going to pretend I can forecast the middle of that range with precision. The point is that the dilution question and the share price at which it happens are critical. Where the needle lands depends on Chairman Laracy’s network, Peterson’s execution, and how the three financing levers above resolve. None of that is in the individual shareholder’s hands. But the signals to watch are.
What to Watch
Here are five signals, in the order cash pressure forces them:
A bridge financing in 2026 (a temporary financing used to fund the company until the main financing package closes). In the UFS schedule, the first pre-production year carries C$64.7M of capital, followed by C$100.0M in the second year. Against approximately C$6M of current cash and a corporate burn already running in the hundreds of thousands per month, the conclusion is the same: Atlas will likely need a 2026 bridge before the senior debt package closes. Peterson said so openly at the PDAC (Prospectors & Developers Association of Canada) convention: “[parties] are coming to us earlier… is there an opportunity to accelerate.” Atlas is going to raise again before the senior debt closes. To stay on schedule, this bridge financing should close in the next few months.
Three things to track on the next tranche: the instrument (equity/debt/convertible), the subscriber (an “unnamed strategic” participated in October 2025), and above all the price if it is equity. Every incremental cent above C$1 is capital saved on the construction-equity stack. But the company still looks clearly undervalued to me, and debt, even short-term debt used as a bridge before senior financing, would be preferable to another dilutive equity raise.A senior project-debt term sheet. With two Letters of Interest from potential debt financiers already in hand, the next step is a term sheet. That’s Peterson’s stated 2026 milestone. Its signing moves Atlas from paper project to bankable project, historically one of the moments that can trigger the sharpest re-rating on junior developers. The next update is expected by summer 2026.
A binding Turf Point access/use agreement, or clear disclosure that lenders have accepted execution of that agreement as a condition precedent to first drawdown. Turf Point is third-party-owned and embedded in the mine plan; a credible senior financing package should either have this agreement signed or explicitly define its execution as a closing/drawdown condition. If a senior debt package closes on schedule, it would be strong evidence that lenders found no blocking issue in the port relationship.
The Sandvik MOU converts to binding. Conversion could move a large and defined equipment package out of the equity-funded portion of the capital stack and tell senior lenders that Sandvik has completed enough diligence to put binding support behind the project. This is most likely to happen alongside or after the senior debt term sheet, not before.
Scotwood, or another major offtake partner, signs a binding agreement. An industrial counterparty is unlikely to sign a binding agreement before seeing a term sheet on the lender side, so this signal is correlated with the debt signal above. Note that the thesis survives its absence; demand for this salt exists whether Scotwood signs or not. What a binding contract adds is timing: confirmation that the commercial chain solidified fast enough to support financing and the construction decision.
Five signals with one question underneath each: has the sequence started working, or has it stalled? The shareholder who tracks them has enough to decide whether to hold, add, or exit. What they do not answer is what Atlas is worth if it all goes through. That’s the next question.
08. The NPV: Decoding the C$920M Headline
C$920 million, after tax, discounted at 8%.
That’s the number every Atlas investor deck leads with. It is also the number I’ve spent the most time looking at, because it is the one the entire project valuation rests on.
An NPV is assumptions all the way down: salt price, escalation, CapEx, sustaining capital, discount rate, tax treatment, royalty mechanics. Move any one of them, the output moves. Move several at once, the output can double or be cut in half. SLR picked its assumptions knowing every one of them would be challenged by lenders spending millions on due diligence before wiring a cent. What came out the other end is a number built to survive that review.
Built to survive is not the same as built to be accurate. The shareholder’s job is to challenge each assumption and ask where SLR was conservative, where SLR was generous, and where the real number might sit. Every previous section has been setting up what we need for the sections that follow.
The Revenue Side
Revenue in the model rests on three assumptions: an initial price, a volume schedule, and an escalation rule.
The Price
The base price is C$81.67 per tonne, FOB Turf Point. SLR built it as a weighted average from Q2 2025 pricing estimates across the four destination markets (U.S. East Coast, Québec, Maritimes, Spot & Commercial), weighted by the planned 56/15.5/8.5/20 allocation. A third-party estimate, anchored in observable prices, designed to survive lender due diligence.
It is almost certainly the floor.
The model applies one price uniformly, regardless of commercial structure (CIF, DAP, FOB). SLR first builds the C$81.67/t from the planned market mix (56% U.S. East Coast, 15.5% Québec, 8.5% Maritimes, and 20% Spot Sales & Commercial) using port-level pricing data. Once that blend is set, the NPV does not carry separate realized-price lines for a DOT tonne, a spot/commercial tonne, or a packaged/retail-related tonne. The salt market does not work that way. As set out in the Business Model section, the channel a tonne travels through can determine what it earns by a factor of two to six. SLR anchored its average on the lowest-margin channel: bulk contracts to public buyers. Any dollar Atlas captures above that would sit outside the C$920M: through Scotwood’s retail JV, through the Québec spot market during Seaway closure, through commercial tonnes sold to contractors pushed to the back of the queue.
Management knows this. Asked directly at PDAC 2026 how the C$81.67 compared to a spot market where parts of Ontario were paying C$300, Nolan Peterson answered: “our base case for the general bulk product market also probably does not reflect the pricing increases that we are going to be seeing next year... there’s a lot of upside that’s not built into our model right now.”
There is one more issue with the C$81.67. The Ontario winter of 2025-2026 should influence the spring contract cycle on which Atlas’s base case rests. Peterson expects a 5-10% uplift beyond normal escalation in the next contract round. None of it is in the model either.
For all these reasons, SLR’s C$81.67 looks closer to a bear case than a base case.
The Volume Schedule
The volume schedule follows a three-year ramp: 1.6 Mtpa in Year 1, 2.6 Mtpa in Year 2, 3.7 Mtpa in Year 3, then 4.0 Mtpa steady state from Year 4 through Year 22, tapering over the final 2.25 years. These numbers are the model’s most untestable assumption: I have not found a clean salt-mine precedent for Sandvik MB670 continuous miners paired with a mostly battery-electric underground fleet at this scale. There is no clean comparable operation to benchmark the ramp against. The only thing supporting the curve is the technical work behind the UFS, Sandvik’s proposed equipment package, and SLR’s sign-off.
Grade is held above 95% NaCl, priced uniformly as bulk road deicing salt. Some intervals of the deposit exceed 98% NaCl and may qualify for chemical or food-grade markets at materially higher per-tonne prices. Too many preliminary hypotheses sit between here and that first premium tonne, so SLR left that option unpriced, and so do I.
The Escalation
SLR escalates the C$81.67 base at 4% per year for five years, then 2% per year through the rest of the mine life, citing consistency with other North American rock salt technical reports. The structural backdrop laid out in Part 1 (supply frozen for twenty-five years, incumbents under operational and financial strain, demand becoming less predictable and more event-driven) sits well above that curve, and the historical record backs it up: U.S. rock salt PPI has compounded at 4% per year for four decades, meaning SLR is modelling the next 24 years at a blended rate meaningfully below a trend that has held through multiple cycles.
That’s fine by me. Feasibility studies are paid to produce defensible base cases, not to predict the future. What matters for the shareholder is the probability distribution of what actually happens over 24 years, and that distribution skews meaningfully above SLR’s curve.
The revenue line behind the C$920M rests on three layers of conservatism stacked on top of each other:
a base price heavily anchored to the lowest-margin channel,
an escalation curve below the 40-year trend,
and no credit for any higher-grade product option,
each of which leaves room above the model for Atlas to earn more than SLR assumed.
The Cost Side
Again, three assumptions here: the capital to build, the capital to sustain, and the cost to operate.
The Build
Pre-production capital is C$589 million. SLR classifies the estimate as AACE Class 3 (a standard level of cost-estimate maturity for a feasibility-stage mining project): an accuracy range of -10% to +30%, which implies a practical estimate band of C$530M to C$766M. Against the sector, that range is narrow: McKinsey’s 202486 review of 80 global mining projects found that cost and schedule challenges affected 83% of recent major mining and metals projects, with CapEx overruns of more than 40% and schedule delays of 20% to 30%. Across its sample, mining projects averaged about 40% real cost overruns. A typical project would land meaningfully above that top bound.
But Great Atlantic is not a typical project. It is a shallow deposit, with no metallurgical processing plant (one of the most common sources of commissioning overruns), no tailings, no shaft, and a short flowsheet that ships salt almost as-mined.87 Each of those is a line item that can blow up budgets elsewhere and is materially reduced or absent here. And on top of that simpler base, SLR still assessed contingency line by line across the budget: extra money set aside upfront to absorb cost surprises before they become real budget overruns. Riskier lines like mine development and the boxcut (the open-cut excavation that accesses the decline) were assigned 25%. The average across all lines lands at 15.1%. That’s C$77.5M of buffer already baked into the C$589M. For Atlas to overrun the published budget, overruns would have to consume that cushion first, then exceed it.
Even if they did, the margin absorbs a lot of it. SLR’s sensitivity table puts a 35% CapEx overrun (relative to the C$589M, and therefore on top of the 15% contingency already baked into initial CapEx) at 14% NPV hit, dropping the headline from C$920M to C$794M. It is a threshold that kills most projects but one that Atlas walks through without really moving the undervaluation.
The same cushion that protects the budget also gives Atlas room to finance it intelligently. The clearest piece is Sandvik: C$132M of equipment and services, or 22% of the C$589M pre-production CapEx, with vendor-supported financing contemplated if the MOU converts. Hatch and Continental do not finance Atlas, at least not on disclosed terms, but they still matter to the financing file: engineering and conveyor systems move from anonymous budget lines into named scopes with tier-one counterparties. Again, none are binding yet. Converting Sandvik into definitive vendor financing, and Hatch and Continental into bankable execution packages, is Peterson’s job between now and Final Investment Decision (FID).
Sustaining Capital
Sustaining capital over the 24-year mine life totals C$609M in the economic model, more than pre-production capital itself in nominal dollars.88 The number covers: new mining levels opened as the mine ages, a fleet expansion from one continuous miner to six, and continuous refurbishment of underground and surface infrastructure.
This is the line item where I think SLR is most likely to have underestimated. Underground mines can come in around 30% above their sustaining forecasts, and far higher when the outliers are included.89 Applied mechanically to Atlas, that would push the actual sustaining bill somewhere between C$790M and more than a C$1B.
In a typical mine, a large part of that overrun often comes from categories Atlas largely avoids: metallurgical processing plant refurbishments, re-engineering as ore grades decline, compounding investments to drain water and stabilize ground in deep or under-lake operations.90 The product grade is modeled above 95% for the full mine life, there’s no metallurgical processing plant, the salt deposit is shallow and laterally continuous, and the deposit starts around 180 meters in relatively simple bedded-salt geology. What’s left is fleet expansion, new mining levels, and conveyor maintenance. Those are mechanical line items that track forecasts better than chemical or geological ones.
I’d expect Atlas’s actual sustaining to land 20-30% above plan. A conservative overrun by the sector’s standards, justified by a project profile that removes the lines where most mines lose control.
What saves the math is the discount. A 30% overrun on the C$609M nominal sustaining curve, spread across 24 years and discounted at 8%, translates into C$54M91 of after-tax present value. About 6% of the C$920M NPV (vs 30% nominal). The time value of money, so often an enemy in 24-year projects, is here an ally.
Operating Cost
The UFS operating cost averages C$28.17 per tonne shipped FOB Turf Point, with operating cost items escalated at 2% per year from the Q3 2025 base. The cost advantage is the assumed C$0.062/kWh industrial electricity rate. As laid out in the operational design section, the electric underground design makes that low-cost hydropower especially valuable. Layering sustaining capital on top brings sustaining-inclusive unit cost to C$34.90 per tonne. Against the C$81.67 un-escalated FOB base price, the sustaining-inclusive cash margin lands near C$47 per tonne (57% margin) before royalties and taxes.
The C$28.17 is realistic as a starting point. Where it could drift is mostly in the Mining line. At C$15.00 per tonne, it is the largest of the three buckets and the one most exposed to wage inflation in a region with competing labour demand. The number worth pressure-testing is the 2% annual escalation SLR applies to operating costs, including labour. Labour is consistently one of the largest components of underground mining operating cost in mechanized operations.92 If actual inflation runs closer to 3.25% per year (closer to recent Canadian mining wage trajectories), and labour costs rise accordingly, labour would add C$1.10 to the Mining cost on a discounted life-of-mine basis. At 4.5%, it would add about C$2.44.93 Probability-weighting those scenarios, labour would contribute about C$1.30 per tonne of drift to the Mining line,94 approximately 9% drift on that bucket and 4.6% on total OpEx. Using SLR’s published OpEx sensitivity, where a 17.5% OpEx increase reduces NPV by 8.6%, that drift translates to about C$22M off the C$920M base, approximately 2.4% of NPV.
Atlas’s site connected load starts at 10.7 MW and rises to 14.4 MW in Year 3 and 16.7 MW ultimately, per the UFS, which translates to approximately C$1.30 per tonne (about 5% of total OpEx). SLR escalates that line at 2% per year. The Newfoundland industrial tariff has trended faster than that recently, about 7.5% per year between 2019 and 2025,95 more than three times SLR’s assumption. That pace reflects two specific drivers: a one-time base rate reset following the 2017 General Rate Application, and the introduction in 2022 of a surcharge to start recovering Muskrat Falls costs from industrial customers, neither of which is structural to a 24-year horizon. But even if the rate kept compounding at 7.6% for the full mine life, the NPV only loses 5.5% (at an 8% discount rate), about C$51M. The risk is real, but its impact is modest.
Stack labour and electricity drift together and OpEx would likely land around C$31 per tonne, about C$73M off the C$920M NPV, about 8%, in this stress case.
If you think I am being too lenient with an 8% haircut to the NPV, wait until we get to valuation.
The Royalty and the Taxes
The project carries a 3% net production royalty payable to Vulcan Minerals on the Great Atlantic mineral licences, calculated in the UFS on gross revenue net of port charges, processing costs, and the NL Mining Tax. SLR has already deducted it from the C$920M. Without it, the NPV would land near C$1B: approximately a 9% transfer of pre-royalty project value from Atlas shareholders to Vulcan shareholders, locked in for the life of the mine. Who Vulcan is and why this royalty exists is covered in the governance section.
Newfoundland and Labrador’s Mining Tax is 15% of the mine operator’s net income, separate from federal and provincial corporate income taxes. The combined effective rate over the LOM appears to land at approximately 35-40% of pre-tax cash flow, in line with what other Canadian mining projects of this scale carry. SLR relied on Atlas and its advisers, including KPMG work, for the tax calculations, standard practice for a feasibility study, but worth flagging that the C$920M sits on someone else’s tax math.
One structural exposure worth naming. Atlas is a single-asset company in a single jurisdiction. Any change in NL Mining Tax rates, federal CCA classes for mining equipment, or the provincial royalty regime flows straight to the bottom line with no offset elsewhere. NL has not materially changed mining taxation in over a decade, and the province has every incentive to keep the regime competitive. But the exposure is concentrated in a way it wouldn’t be for a multi-asset major.
The Sensitivity Analysis
SLR runs four variables through its sensitivity table: salt price, operating cost, pre-production capital cost, and production losses. Here are the numbers.
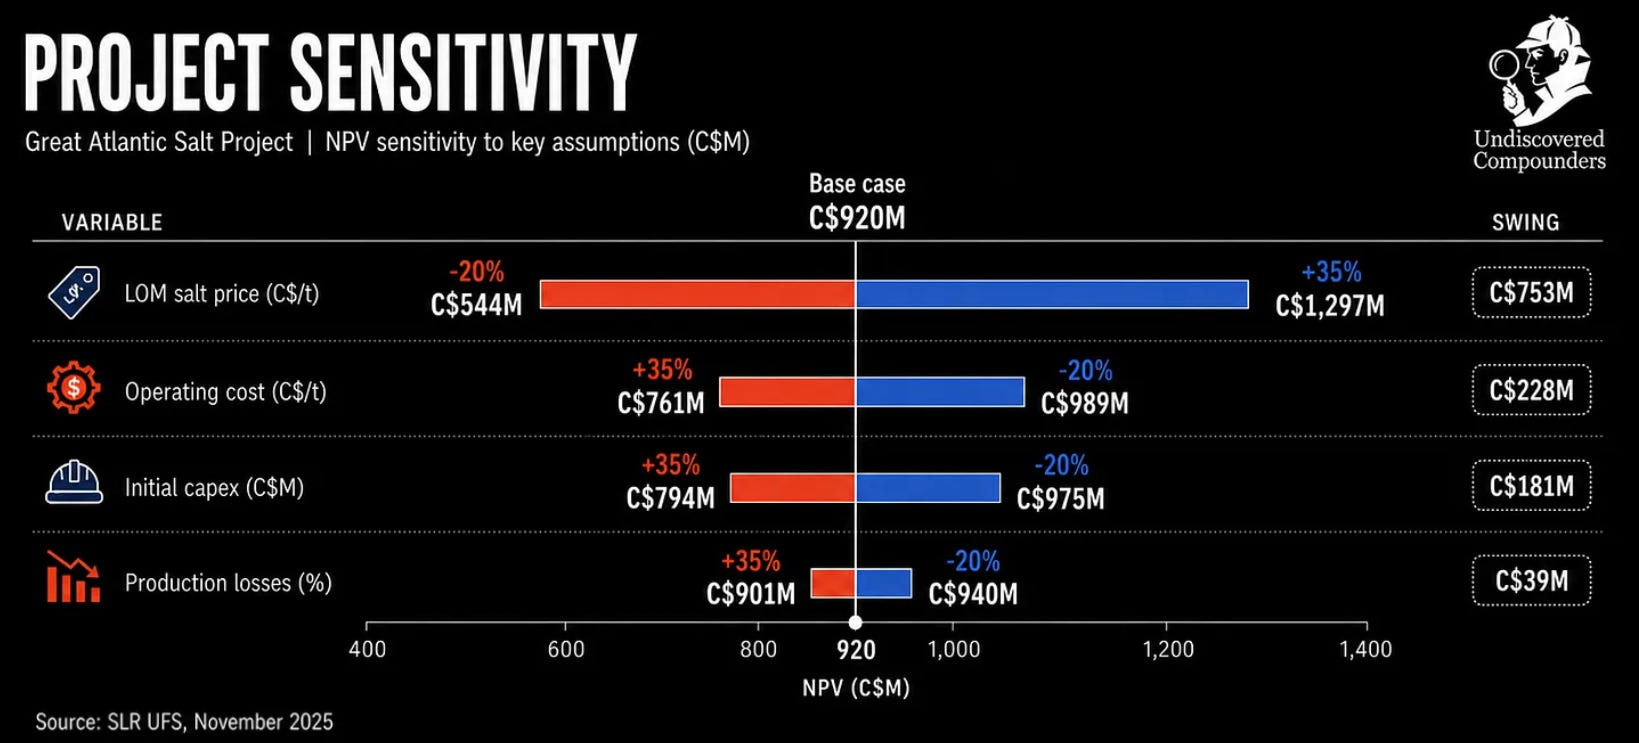
Salt price is the dominant variable, and by a wide margin. A 20% adverse move in the LOM (life-of-mine) salt-price assumption wipes out 41% of the NPV. Every other variable is secondary. OpEx and CapEx matter, but are absorbed by the project’s wide gross margin while production losses are essentially immaterial. This is why the salt market takes 10,000 words.
This is also why Atlas is such a large opportunity. The company is not only priced unusually cheaply for its stage of development, but the most important assumption embedded in that valuation is also, in my view, materially underestimated. It is a growth setup embedded inside a value setup, created by the fact that few investors understand the salt market, including most mining investors.
One thing worth noting: the -20% case (C$65/t FOB) is still about C$30/t above Atlas’s sustaining-inclusive unit cost of C$34.90/t, meaning even at a 20% price haircut, the project generates positive cash margin before royalties and taxes and retains approximately C$544M of NPV. This is the structural consequence of the margin moat discussed above. Few mining projects can say that.
The Discounting Mechanics
The C$920M headline is a present-value figure, base date Q3 2025, discounted at 8%. The model projects 28+ years of cash flow (4 construction + 24.25 operations), then collapses them to a single number using one arithmetic operation: divide each future dollar by (1.08)^years from base date.
Over the 24-year mine life, Atlas is projected to generate C$6.66 billion in pre-tax undiscounted cash flow. After discounting at 8%, that becomes C$1.68 billion pre-tax. After taxes and discounting at 8%, it becomes C$920M. The time value of money eats approximately three-quarters of the nominal cash before taxes: a tonne of salt shipped in 2053 is worth only 15% as much as a tonne shipped in 2030.
The UFS gives three discount-rate cases, and the spread between them is the single most revealing line in the sensitivity table:
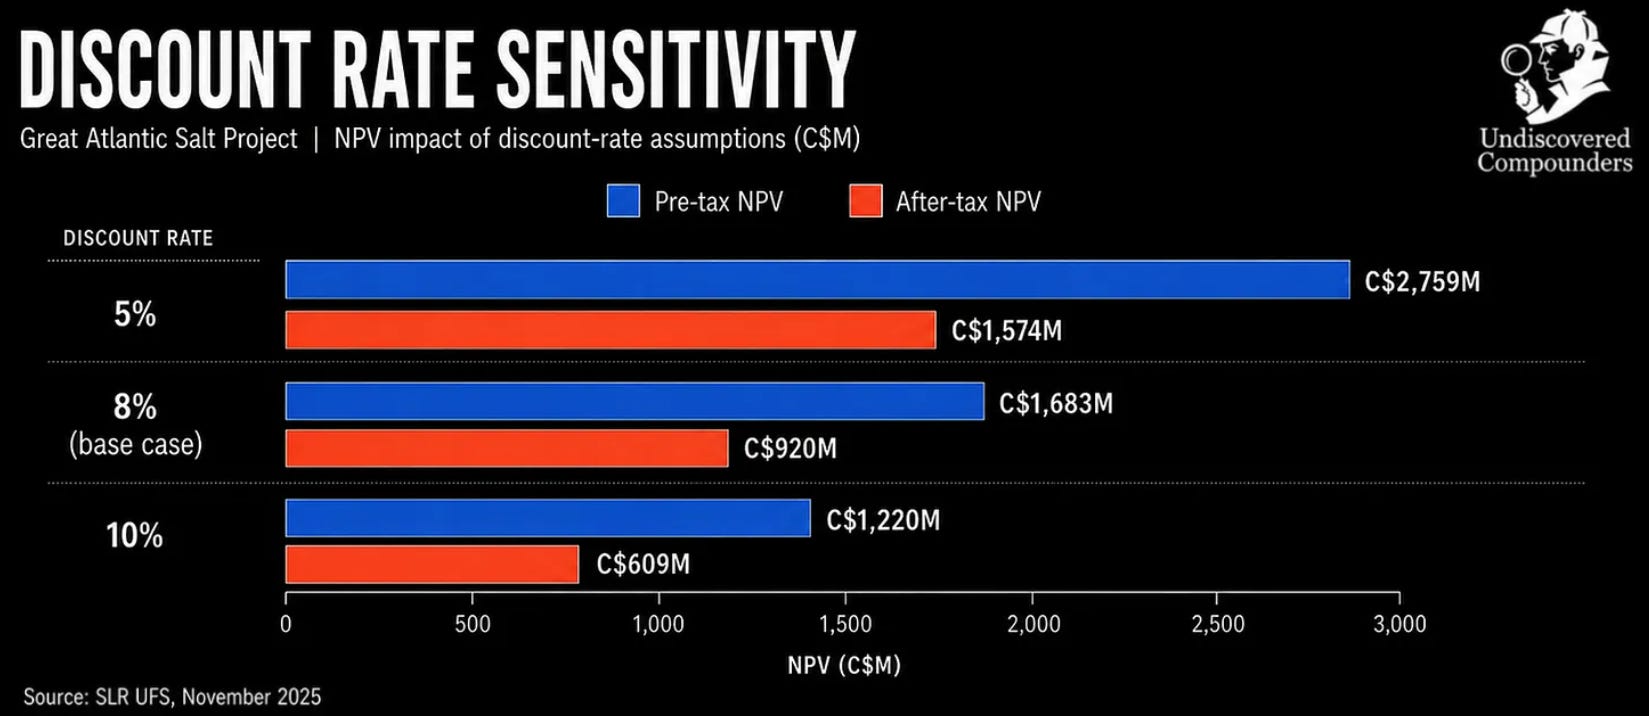
Moving from 8% to 10% costs the project C$311M: 1/3 of the headline NPV for two percentage points of discounting.96 That is the largest analytical lever in the model, larger than any operating or capital variable in SLR’s sensitivity table.
And it is exactly where my shareholder reading has to diverge from the model.
Why 8%?
Across 100 NI 43-101 reports filed on SEDAR between 2008 and 2020, the average discount rate was 7.18%,97 with a large cluster at 5% and another around 8%. Gold and precious metals projects skew toward 5%; copper and several industrial or specialty-mineral projects in the sample sat closer to 8%.
So why 8% for Atlas?
The convention varies by commodity, jurisdiction, and stage. AMEC’s reference paper98 on the topic notes that a 2-3% premium is standard practice for juniors with limited development experience, no prior exposure to the project’s commodity, or single-asset exposure. Atlas checks all three: junior, no team in North America has built a salt mine in 25 years and one asset in one jurisdiction. By the AMEC framework, SLR could have justified pushing the rate to 10-11% and stayed within convention.
It did not, and for two reasons we’ve already covered. Salt is a commodity with very low volatility (contract price; spot volatility skews to the upside) and a stable upward trend across decades (4% CAGR over forty years). Also, the mine is structurally simple. The things that tend to go wrong elsewhere have fewer entry points here.
The cash flow profile of Great Atlantic in production looks closer to an infrastructure-style industrial mineral asset than to a typical junior mine. It is long-lived, contractable, essential, and tied to an end market where buyers are forced to secure supply before winter. The risk profile should therefore compress materially if the mine is financed, built, and contracted.
So the math sits on a balance. The junior premium pulls up, while the cash-flow stability pulls down. SLR landed at 8%, which sits near the non-5% mining convention and close to where industrial/base-metal projects tend to cluster. Clearly not generous, reasonably fair today, and definitely conservative once the mine is financed and operating.
My Choice of Discount Rate
A discount rate exists to translate future cash flows into present value.
The more unmodeled risks an interval of time contains, the more aggressively future money should be discounted.
From there, I had three choices.
I could push almost all the risk through the discount rate, then value Atlas Salt by flexing the UFS NPV at different rates. I could do the opposite: identify and quantify every risk directly, apply those deductions to the project value, and discount the remaining cash flows closer to a risk-free rate. Or I could use a mix of both. I chose the third path.
I try to identify, quantify, and charge as many Atlas-specific risks as possible. But I also accept that some risks remain outside my reach. The next two sections do most of that work. They are where I quantify the major risks and apply the relevant haircuts.
That leaves the discount rate itself. SLR used 8%. I will say it now: I am already charging far more risk than SLR could reasonably load into a feasibility-study NPV. There is a reason the next two sections represent about one-third of this entire deep dive. I could probably justify using 5% after explicitly modeling so many risks, but I do not want to.
Two reasons.
First, the probability that 5% would be aggressive is too high. I want to avoid inappropriate conservatism, but I also refuse to build the investment case on aggressive assumptions.
Second, simplicity. SLR built the UFS around an 8% discount rate and only provides sensitivities for selected variables, with discount-rate outputs at 5% and 10%. Keeping the 8% anchor makes the bridge cleaner and easier to audit.
So I keep an 8% discount rate throughout the valuation.
Using 10% would be even less appropriate in my view. It could have been defensible inside the UFS as a broad risk adjustment. But after explicitly charging financing friction, working capital, corporate costs, residual leakage, execution risk, delay risk, ramp-up risk, dilution, and many interactions between those risks, applying a 10% discount rate on top would double-count too much of the same risk.
The preamble is over. Now to the real work: assessing risk.
9. Risks
The Financing
Atlas owns a feasibility-stage project with C$589.1 million of pre-production CapEx, a C$920 million after-tax NPV8, and no operating cash flow yet.
Before the thesis can become real, that financing gap must be closed. The risk is that it closes on terms that dilute away too much of the upside for existing shareholders.
Atlas raised C$8.7 million in October 2025, giving it enough capital to keep advancing early works and engineering, but not enough to build the mine. By year-end, cash was already back to C$6.0 million, which would not be enough to fund even the first half of 2026 now that early works had begun. The UFS allocates C$64.7M to YR-4 (2026), including C$39.3M of mining capital (starting around middle of Q3-2026), before the project steps into a C$100M second pre-production year. Atlas will therefore need to raise additional capital in Q2 2026, or by early Q3 2026 at the latest, if it wants to stay on schedule. Endeavour Financial is leading the project-financing process. But the full project-financing package is unlikely to close before the bridge cash need arrives, making a bridge financing almost certainly required. Sandvik has announced an expanded non-binding MOU covering approximately C$132 million of equipment and services, with vendor-supported financing contemplated if the agreement converts into definitive documentation. Scotwood, Hatch, and Continental Conveyor also reduce the “empty-shell” problem: Atlas is surrounding the plan with a prospective customer/retail partner, engineering, equipment, and material-handling partners.
Some dilution is unavoidable. Even if the company is able, on paper, to raise all the required capital through debt, senior lenders will likely require a minimum equity contribution to align stakeholders and cover items debt will not fund (part of the financing fees, vendor deposits, contingencies, etc.). More than a question of price, it will also be a question of timing. If Atlas does its bridge financing with equity, that dilution will probably happen at a valuation close to today’s. But if dilution is pushed back, for example after a binding offtake or vendor contract or after the announcement of the main senior project-financing package, those milestones should be reflected in the valuation, and the equity raise would make more economic sense. The near-40% insider/related-party ownership has to play its role precisely here.
From here, the checklist is fairly clear:
Bridge financing in the next few months (by early Q3 at the latest), to keep Early Works moving while Atlas waits for the main project-financing package, ideally through short-term debt or through a favorable convertible structure.
Conversion of Sandvik’s MOU into binding vendor financing.
A senior debt term sheet, with an update expected around summer 2026 according to the CEO.
Additional binding offtake, especially any upgrade to Scotwood’s volumes or terms. This would reassure potential lenders. For shareholders, it would be one of the most important milestones, because it would confirm that a meaningful portion of Atlas’s salt could be sold at better margins than the UFS valuation captures.
The price and timing of any equity raise. This is the key dilution variable. Equity raised before the next milestones is, in my opinion, expensive equity.
The Build
This is the second major risk for junior miners, alongside financing.
Great Atlantic Salt does not carry the full usual hard-rock mining risk stack. What remains is more practical: can Atlas access the deposit, build around it, and ramp it at the cost and pace assumed in the feasibility study?
It is SLR’s job to quantify all of this in the UFS, and here is its conclusion: after mitigation, the two risks that remain high are failure to achieve the planned decline advance rates and capital cost increases. In plain English, the declines can take longer to drive than planned, and it can cost more to build than planned. Groundwater inflows, grouting, dewatering, contractor productivity, and the rest all flow into the same bucket: time and money before first cash flow.
The problem with delays is that they increase the amount of capital the company needs before the mine starts funding itself. As we just saw, capital raised before the re-rate is the most expensive capital in the story.
Some mitigation is already embedded in the plan. Atlas and its consultants have completed a substantial geotechnical and hydrogeological program, including drill holes, packer tests, vibrating wire piezometers, and laboratory testing. Atlas is also trying to reduce execution risk the right way, along the lines SLR recommends: experienced mine-build management, early engineering work, contractor engagement, and fixed-price packages where possible. It has also put real names around the project: Hatch on engineering, Continental on material handling, and Sandvik on the underground equipment package.
But reducing uncertainty does not eliminate risk: advance rates are only proven once the declines are being driven, and water management is only proven underground.
I do not underwrite those risks as project-killers. As we have seen, cost overruns beyond the contingency already embedded in the UFS have only a moderate impact on NPV, while delays mainly show up as higher pre-production funding needs. Great Atlantic is a simpler build than most mines, and several parts of the design draw on proven salt-mine analogues, including Kilroot, an underground salt mine in Northern Ireland that has been operating since 1965.
I would rather underwrite them as dilution amplifiers. If the declines advance more slowly, if water proves more annoying than expected, or if CapEx drifts higher before the financing package is locked, the asset could still be built. But current shareholders may simply have to pay more of the bill, either through less favorable financing terms, or through direct dilution at valuations that would probably be unattractive.
That is what I will watch:
Follow-up geotechnical and hydrogeological work on the declines. Atlas has already completed a substantial program, but SLR still recommends additional packer testing, groundwater monitoring, transient modelling, and updated inflow estimates before full construction. If this work comes back clean, it would reduce much of the biggest modeled source of delay and extra CapEx.
Binding execution packages with Hatch, Continental, and Sandvik. The MOUs help, but they do not yet lock scope, pricing, or schedule.
Remaining capital-phase permits, Turf Point approvals, and the commercial port-use agreement. Full construction and port execution are not fully de-risked yet. Once they are, one more bottleneck disappears. The port question matters enough to come back later.
A refreshed CapEx and schedule before FID (Final Investment Decision). The UFS number is only the base case. A more precise cost-and-schedule package would de-risk the project, even if it comes in higher than the current estimate. Less uncertainty on the final bill means less uncertainty on the financing need, and that alone could justify a meaningful re-rating.
Actual decline performance once excavation starts. This is the central build risk: how many meters Atlas can advance per month, and what that says about other risks (water inflows, grouting, ground conditions, etc.). The first months of decline development will be the best early indicator of whether the schedule is holding.
The Commercial Ramp
Even if Atlas finances the project on acceptable terms and builds the mine within the UFS envelope, it still has to sell the salt.
This is not a trivial point, but it is not the central one either. Great Atlantic is not expected to go from zero to 4.0 Mtpa overnight. The UFS assumes a ramp-up, with saleable production starting at 1.6 Mt in the first year before scaling toward nameplate capacity. That gives Atlas time to place its volumes into the market gradually.
The market context also helps. As discussed earlier, Eastern North America is a seasonal, import-reliant road salt market. Deicing salt is not a new product; Atlas is “only” trying to replace tonnes that already move into the region every winter, often from much farther away. The project sits approximately three days from U.S. East Coast ports, can serve nearby Canadian demand, and should be able to ship year-round. The Scotwood MOU also matters here because it shows that a large packaged-salt distributor is already willing to engage before production.
I would frame this as low relative risk on demand. Given the supply-demand tension in North America, Atlas’s salt is likely to find buyers. The question is at what price.
Even if the Scotwood MOU does not convert, even if Atlas fails to penetrate the retail market quickly, it would still be a potentially lower-delivered-cost source of salt in many target lanes, with better reliability than distant imports and a cost position that would be competitive with legacy local suppliers. And in this market, that is everything: reliability and price. So if needed, it could use part of its cost advantage to win tonnes at lower realized prices. That would not be ideal, but it is very different from having no market.
In the end, the commercial ramp has one job: turn tonnes into the highest possible realized price.
What I will watch here is the sales mix:
Scotwood conversion, or another major offtake partner. Atlas should try to sell its salt at the highest available margins, but not by becoming overexposed to one channel. In retail and packaged salt, the right path is partnership. The sweet spot, in my view, would be 50-66% of production placed with two or three strong retail/commercial partners, leaving the rest for bulk contracts and spot optionality.
Contracts outside the basic bulk deicing channel. As a shareholder, I want evidence that the customer book is broadening. I do not want Atlas to enter the final construction year with one dominant channel and a financing case built around a narrow buyer base. Senior lenders will likely think the same way.
A clear logistics strategy for local and regional sales. If Atlas wants to earn more than bulk port pricing by selling salt itself, it needs to show how those tonnes actually reach the customer. Since Atlas has mentioned the possibility of local salt sales before the first official year of production, it would need to figure out the logistics early and show stakeholders that the system works.
The Salt Price
The single most important variable remains the average realized salt price.
A few mild winters can hurt volumes, spot pricing, and the timing of reorders. That does not bother me much. Road salt demand has always moved with winter severity. What matters is the long-term direction of the market: more disruptive winter events, shifting demand geographies, supply chains built for the old map, and buyers that increasingly care about reliability as much as price.
The real long-term risk is regulatory change or innovation that structurally reduces rock salt usage. For now, I do not see it. Environmental pressure is real, especially around chloride accumulation, but the policy response to date has generally been to adopt better salt management practices while still relying heavily on salt or salt-derived products.
That said, this is a variable I will monitor continuously during the holding period. Road salt has survived decades of environmental scrutiny without a scalable replacement because it remains cheap, available, effective, and easy to deploy. But a new credible substitute that works at scale and at comparable cost would be one of the main paths to permanent capital loss, even if I think it is very unlikely. This risk can only be mitigated by active information monitoring. If I ever come across something credible enough to change my view, I will obviously write about it.
The Permitting Tail
Permitting has already done most of the work it needed to do for the thesis. Great Atlantic Salt was released from the provincial environmental assessment process in April 2024, with conditions, and the federal agency (IAAC) confirmed that the project does not require a federal impact assessment. Since then, Atlas has received early works approval and started moving from paper approval to site preparation.
What remains is the permitting tail that comes with any mine build: translating the environmental release into phase-by-phase approvals, satisfying the conditions attached to the release, and making sure the final construction design stays inside the envelope regulators have already reviewed.
This risk is not fully eliminated. It never is. A missing approval can delay a work package. A regulator can ask for more detail. A design change can force another round of process. But this is no longer the kind of permitting risk that usually deserves a large valuation discount. The big question, whether the project is broadly acceptable in Newfoundland and Labrador, has already been answered.
I will watch whether the remaining approvals move in line with the construction sequence. The project has already cleared the main permitting gate, so the main thing that matters now, in my opinion, is whether conditions, phase approvals, and the Turf Point port work create friction at the wrong moment. If they move with the build, the permitting tail stays a schedule detail. Great. But if they start delaying critical work packages, it will become a real financing problem, with the consequences discussed above.
The Port Agreement
Here is the risk in physical form:
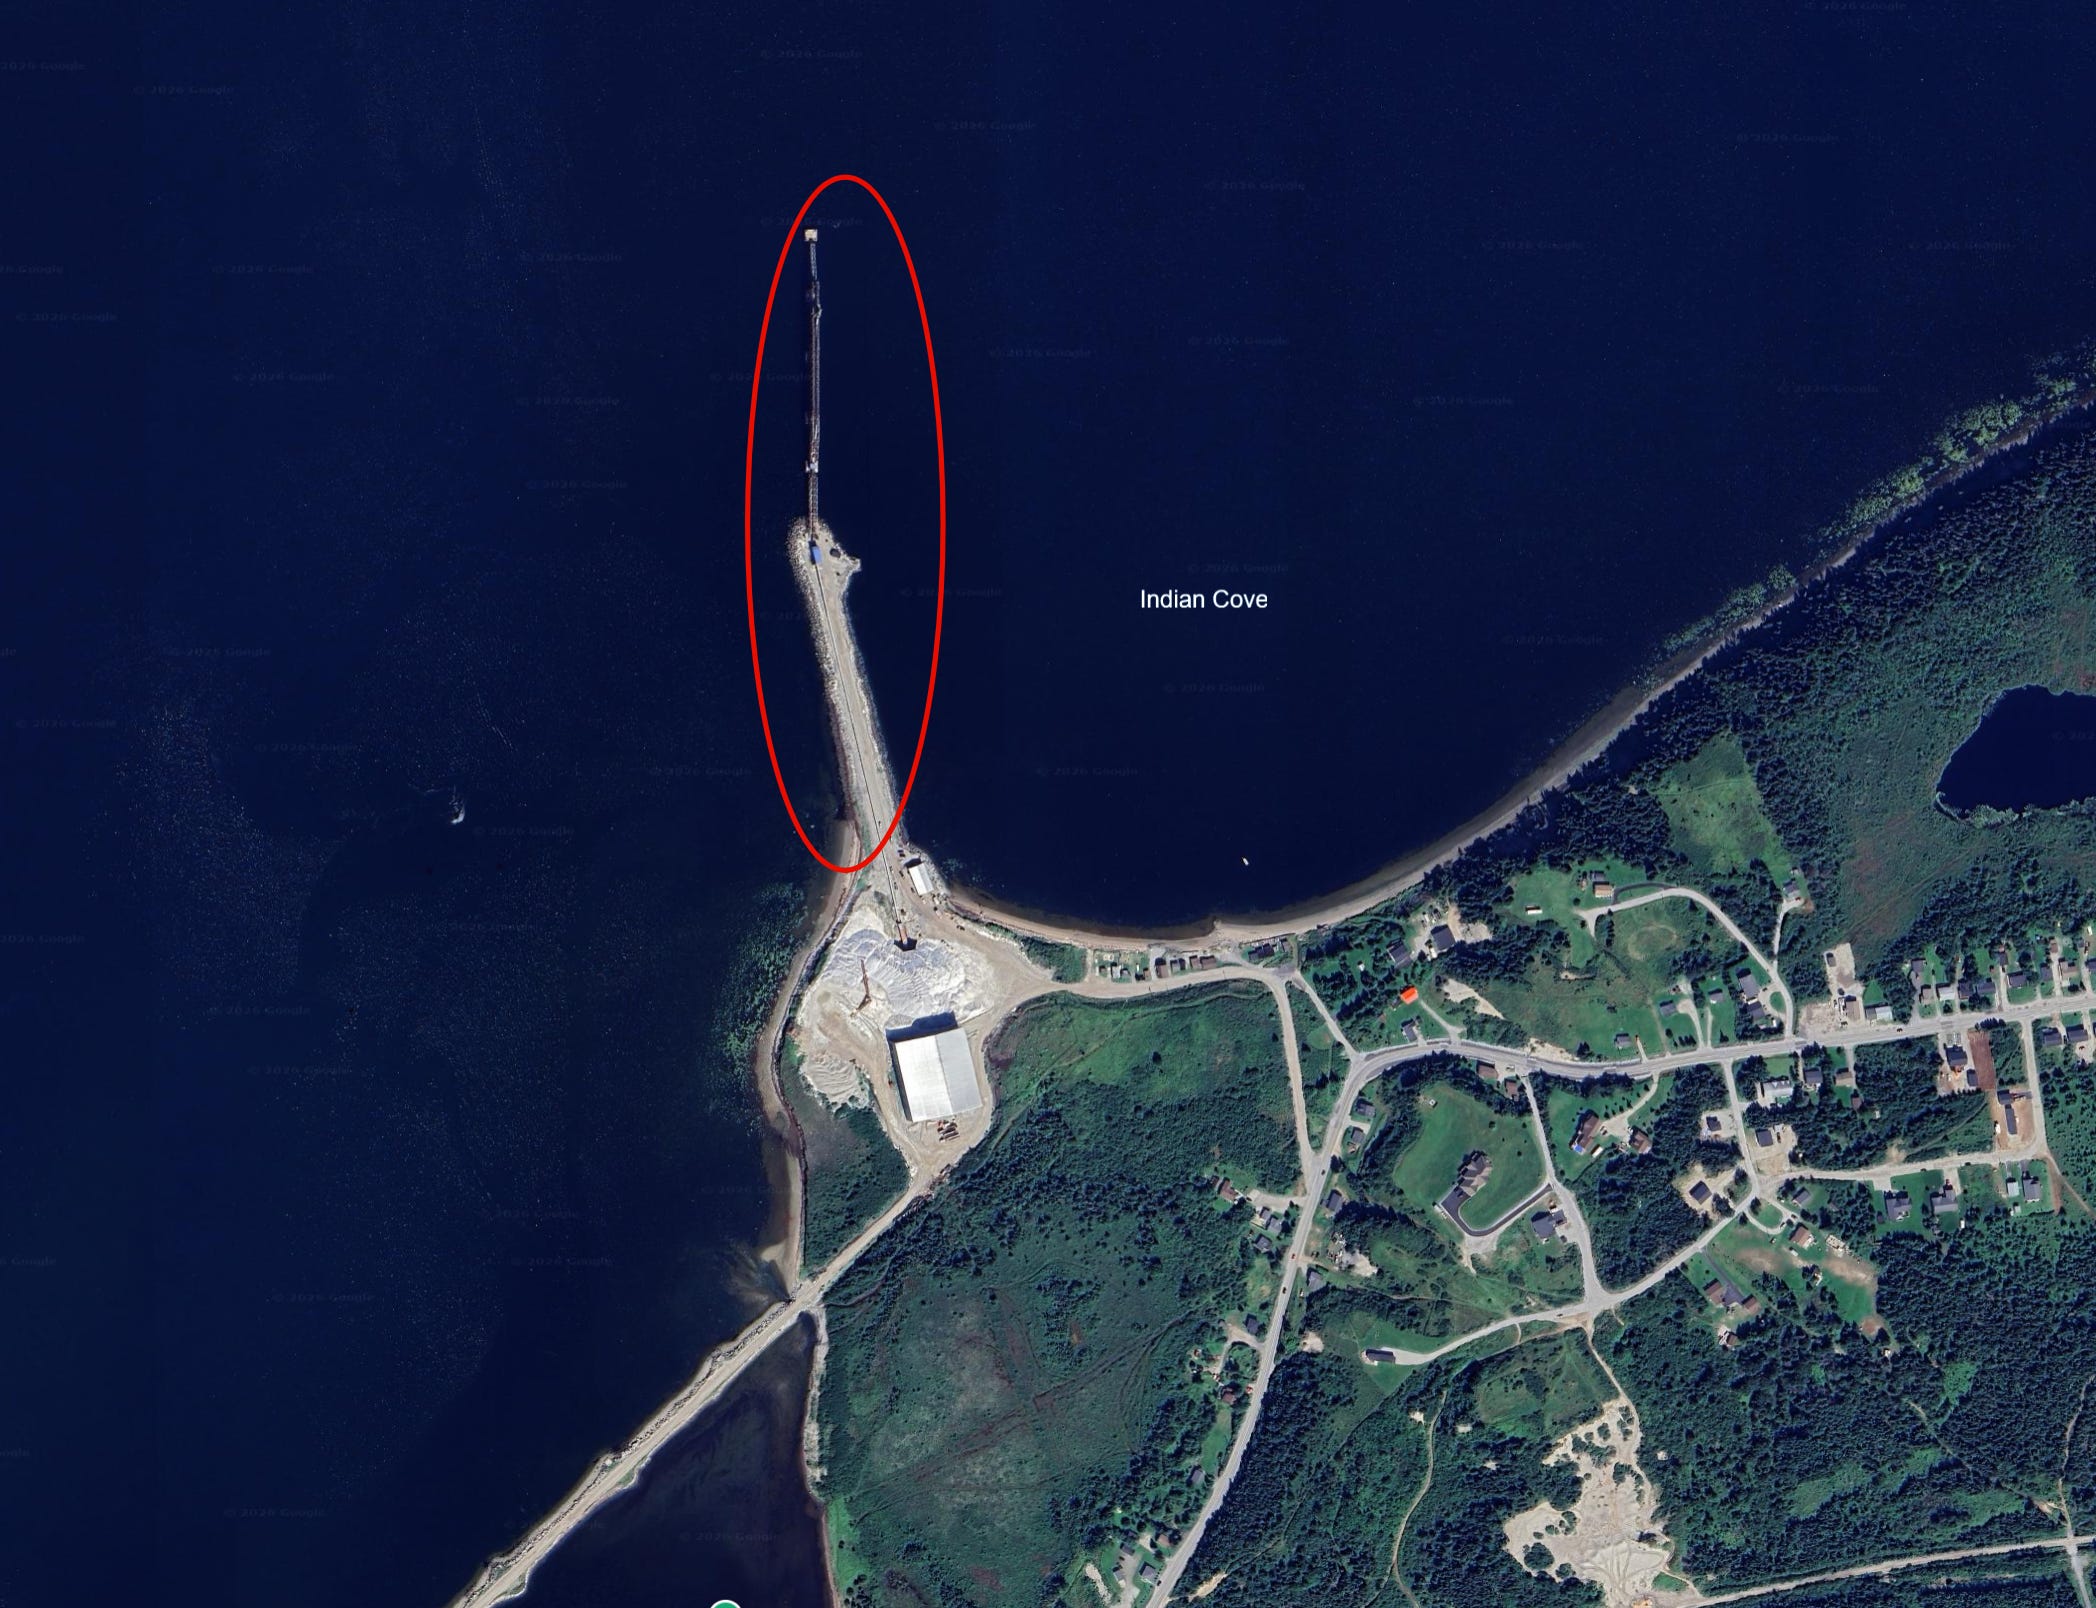
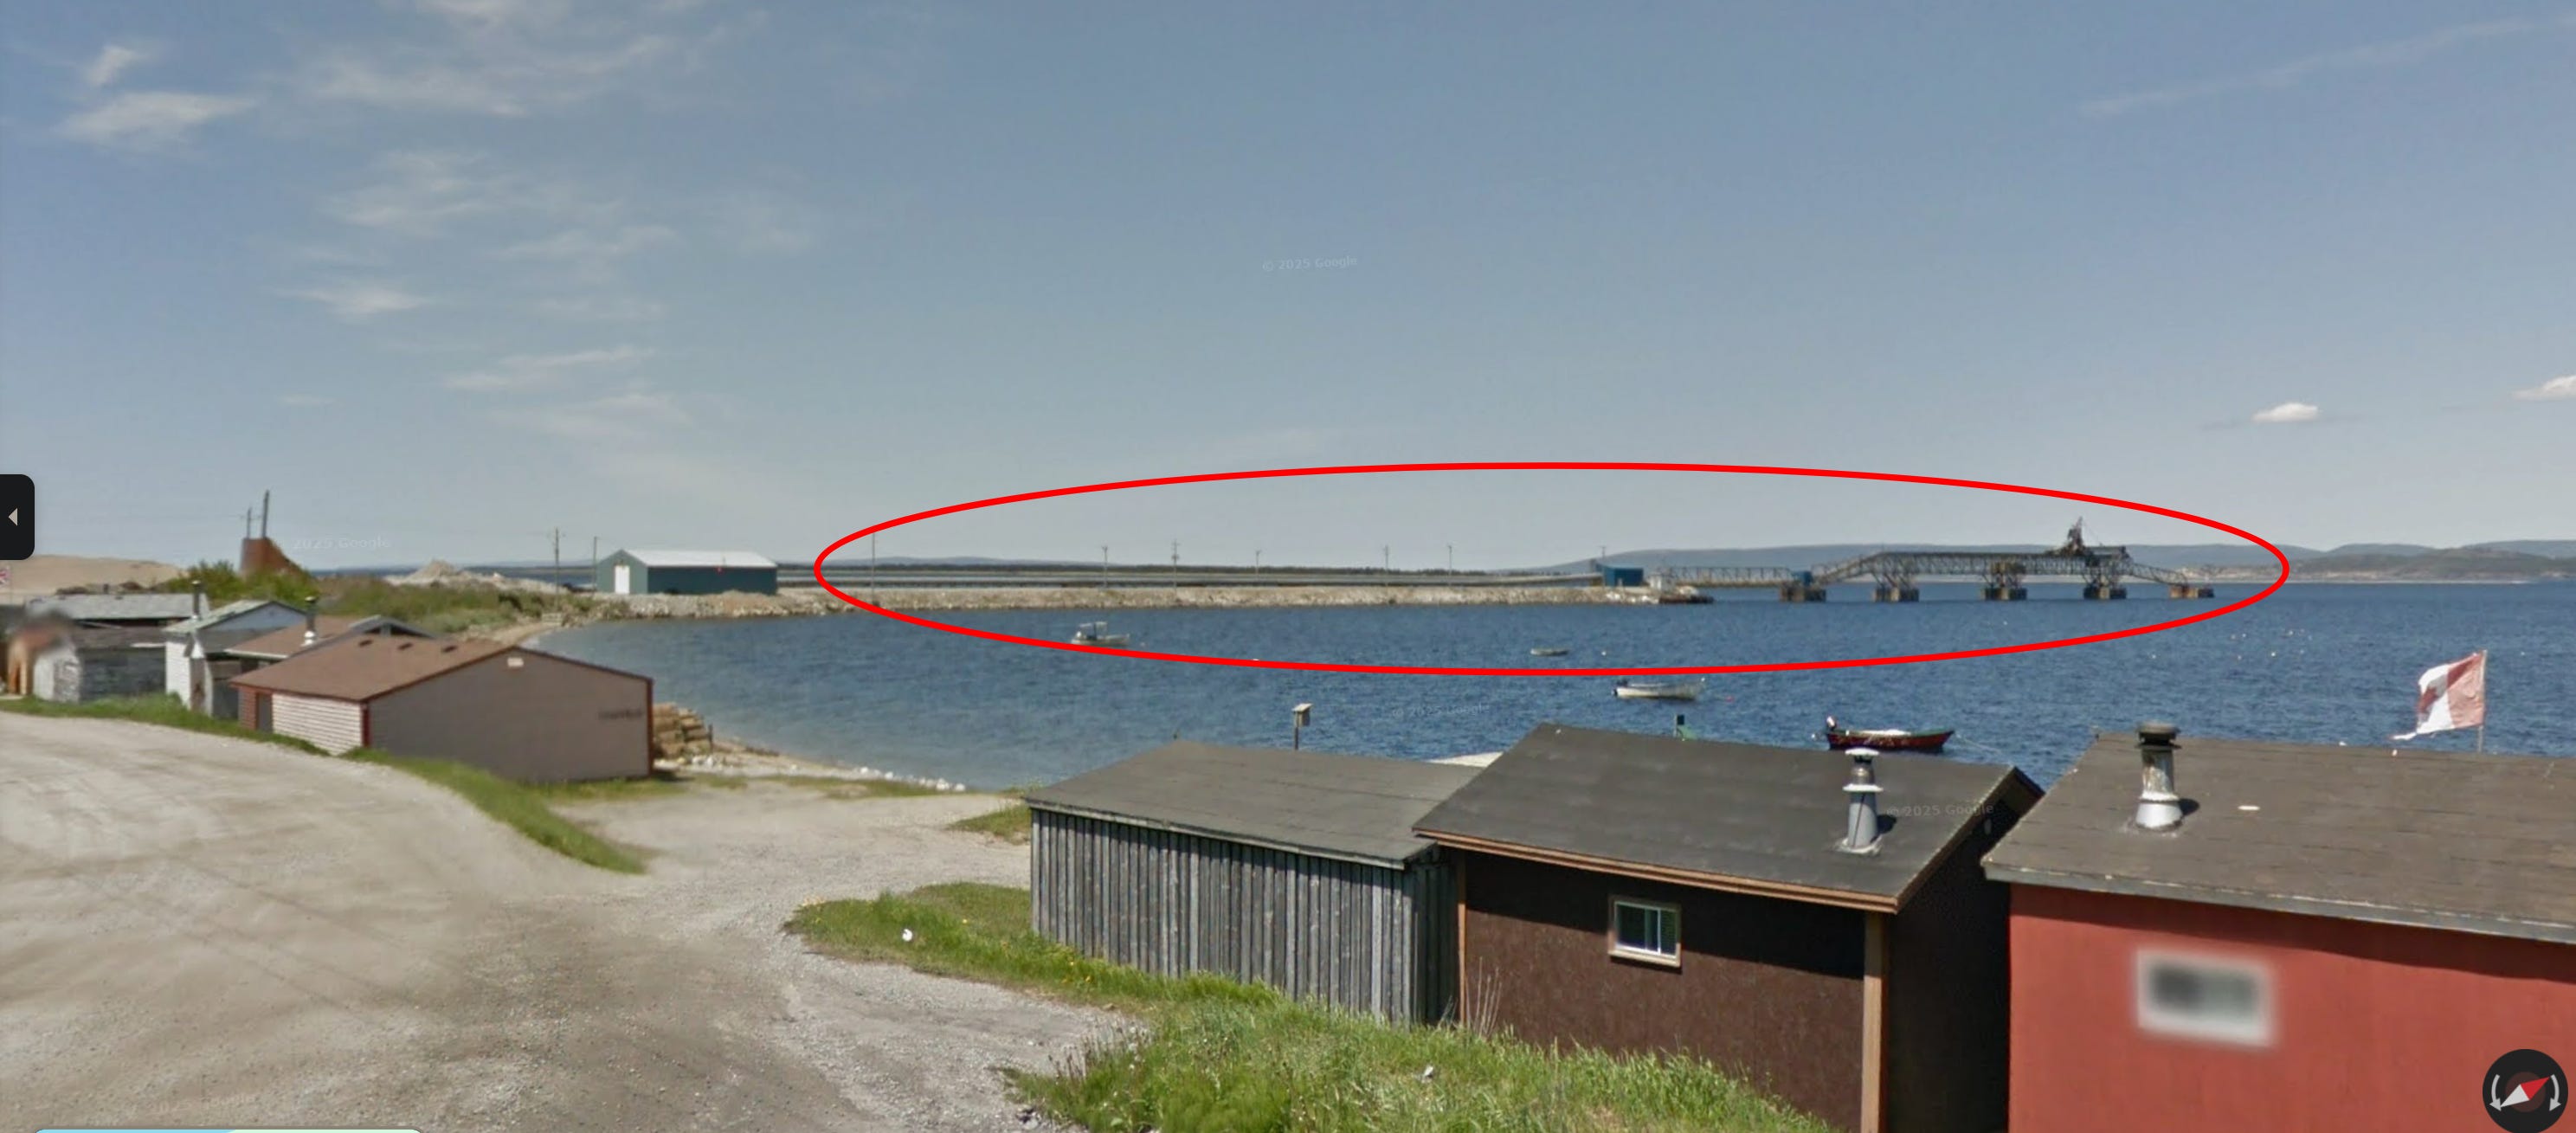
Yes, this is a small port. A very small one, actually. One single ship-loading system. And from that small piece of infrastructure comes a risk that could derail the whole thesis, one Atlas does not fully control: the commercial agreement with the owner of Turf Point. Every number in this deep dive assumes that at some point before first salt shipments, this agreement is signed.
From an operational perspective, every other counterparty can, in principle, be replaced: offtaker, equipment supplier, engineer, lender. The port cannot, at least not without redesigning the full logistics case. The mine plan, the conveyor, the material-flow route, the site layout, and the environmental assessment are all built around this specific port. There is no alternative deepwater port within similar economic distance.99 Atlas is structurally captive to one counterparty.
This is far from a red flag today. Atlas is approximately four years from planned first revenue and has not closed its main financing package. The red flag would appear if financing stalls and the port is cited as the reason.
Several things mitigate the risk:
First, Turf Point is not a greenfield port. Atlas, first through its corporate predecessor Red Moon and now under the Atlas Salt name, has long operated in the same district and is already using Turf Point to ship gypsum from the Ace Gypsum quarry since the first shipment in September 2018. The commercial relationship with the port operator has been continuous for years and remains active in 2025, with C$67,000 in gypsum proceeds recorded through the first nine months of the year. Given management’s track record and standing in the region (particularly Laracy), the relationship likely predates the current salt-project negotiations through his various ventures.
The incentives are obvious. Atlas plans to spend C$58.5M on upgrades to a port it does not own. By the end of the capital program, the port owner should hold a substantially more valuable asset, without necessarily paying for the upgrade itself.
If Atlas completes the upgrade as planned, the existing berth’s loading capacity would rise to 1,400 tonnes per hour. At a 4 Mtpa throughput, this translates into approximately 10 hours of loading per day across 285 operating days per year, every year, for most of the 24-year mine life. Compare that with Turf Point’s current documented export base of approximately 150,000 to 200,000 dry tonnes per year of gypsum. It is as if Amazon approached a small regional airline offering to pay for a new plane fresh off Boeing’s assembly line, and then pay for 24 years to use it.
The counterparty is a local family-owned business rather than a large corporate group with extensive capital and legal resources. They could try to leverage their position within this relationship, but any impact on the NPV should not be large enough to break the economics.
The risk also appears to have been worked on by management for years. In the NI 43-101, SLR notes that it relied on a 2021 Stewart McKelvey “Turf Point Property, Report on Title” memo from Justin Hewitt to Patrick Laracy for ownership and title information. Hewitt is a Stewart McKelvey lawyer in St. John’s whose practice covers corporate, commercial and real estate matters, including mining and commercial agreements. That means the legal status of the port had already been identified as a specific due diligence item years before this project-financing process.
That matters because lenders will almost certainly require the same point to be cleaned up before construction debt is committed. The title work is the beginning of that process, and it began several years ago. Before construction debt is funded, lenders will likely require a binding port access/use agreement, plus protections around capacity (tariffs, term, termination rights, remedies, etc.). The relationship must become bankable before construction debt can be drawn.
On operational timing, the UFS gives little concrete detail. The port works are described, but Turf Point does not appear as a separate visible workstream in the summary execution schedule. The only explicit timing disclosed is on the permitting side: in-water works may require Fisheries Act approvals that could take 18 months or more, although SLR believes the current execution schedule leaves enough time to obtain approval before port construction begins. Still, it also means the port remains less transparent on timing than the mine itself.
On paper, this is a symbiotic relationship. Atlas can bring enormous value to a local infrastructure asset; Turf Point, in return, gives Atlas the export route that makes Great Atlantic work. In practice, we cannot know every friction point before the agreement is signed. But both sides have a lot to lose if the contract is not signed. And I suspect the Dolomount family, which controls the port, wants this mine to be built at least as much as I do as a shareholder.
So I see the risk as very low probability, but potentially devastating if it materializes.
I will watch two things here.
Obviously, whether the port agreement has any impact on the schedule, including through the potential 18-month-plus permitting process for in-water works.
More importantly, whether the main financing package arrives on time. Senior lenders should have access to far more information than we have on the relationship between Atlas and Turf Point. If the financing package closes on schedule, it would be a strong signal that they found no blocking issue in this potential bottleneck.
The most important risk is the average realized salt price Atlas would achieve. I am willing to accept the other risks materializing: construction delays, CapEx overruns, even financing that is not especially favorable. The mine could be two years late and CapEx could come in 50% above budget; if Atlas signs a binding contract with Scotwood or another distributor to push 50% of production into packaged/retail-related channels, and if salt prices keep following something close to their historical trajectory (which, as a reminder, reflects durable economic forces), the real project value could still end up above the C$920M NPV.
Speaking of valuation, it is finally time to get to the heart of the matter.
10. Valuation
The Ratio and Its Double Reading
Buying Atlas today costs approximately C$120 million. Building the mine would cost C$589.1 million more. Almost 5x what was just paid to own it. At the end, if the UFS holds, a mine throwing off approximately C$188 million in after-tax cash flow per year, for more than two decades at least.
Put plainly: P/NPV is about 0.13x. For every dollar of value SLR assigns to the project, the market pays thirteen cents. Producing mineral assets typically trade closer to 0.6x to 1.0x of NAV/NPV. Atlas is not producing. But even adjusted for what separates today from 2030, the gap is unusual.
The C$920 million NPV sits at the project level. It is the UFS value, discounted back to Q3-2025, before any adjustment for financing, dilution, execution risk, or the fact that shareholders do not yet own a producing asset. Today’s market cap is a different object. One describes what could be, the other what is.
No simple arithmetic reconciles them. What bridges the two is the set of risks a greenfield mining project still carries. Atlas has cleared most of them. The provincial environmental assessment process was cleared. The reserve and resource base is defined. The local community is onside.
What remains is execution and financing, the two risks that dominate the next four years. Both need to be read in light of what was discussed in Sections 2, 3, 7, 8, and 9: Great Atlantic’s characteristics should make execution risk lower than in a typical mine, and the same features should also reduce financing risk, made easier by the nature of salt pricing: low volatility and a clear upward drift over time.
Two readings of the 0.13x P/NPV coexist.
The first is that the market is pricing those risks honestly. A junior four years from first tonne, with no construction financing closed and no binding offtake, can deserve a steep discount to its modeled NPV.
The second is that the ratio mostly reflects factors outside the project itself: no real analyst coverage, TSXV illiquidity,100 exposure to an industrial segment generalists find boring, and the hangover of the 2022-2025 junior mining cycle.
I spent the rest of this section arguing that the second reading is closer to the truth, and that even if the first reading deserves more weight, the math still works for patient capital.
Before getting there, one more filter has to be named. Even if Atlas delivers exactly what SLR models, the existing shareholder does not keep a 100% economic claim on the full C$920M. Between now and first tonne, Atlas still has to raise a large equity cheque, approximately C$125M to C$383M in my model, depending on the final debt stack, vendor financing, bridge financing, and the full project funding cost, including the items treated outside the headline UFS and initial CapEx (see Section 7 and 8). The price at which that equity is issued determines what’s left in existing hands.
At C$0.50, little. At C$2.50, much more.
Two questions shape what follows. Why does a junior rarely trade at 1x P/NPV, even when everything goes right? And what’s left for the existing shareholder once the project is financed?
Qualitative Valuation
Here, no heavy math, promise. The dirty work, assumption by assumption and discount by discount, comes in the subsections that follow. This first pass is only meant to check that the napkin is not too far from a desirable outcome.
Producing mines rarely trade at 1x P/NAV. Even the best operators, in tier-one jurisdictions with steady cash flow, usually trade at a discount. That is not irrational. A discounted cash flow is the present value of every future year through the mine’s depletion, and every one of those years still has to happen.
The earlier you are, the wider the discount.
Methodological note. Throughout this analysis, I often refer to Atlas through the Great Atlantic Salt’s NPV because, for underwriting purposes, Atlas is effectively a single-asset developer. In mining equity research, valuation comparisons are usually framed as P/NAV. NAV captures the value of the entire company: project NPVs, cash, debt, and other corporate adjustments. NPV is the present value of a specific project. In Atlas’s case, the distinction is mostly semantic: Great Atlantic Salt drives almost all of the company’s current value, while cash and liabilities are small enough that Atlas’s NAV is very close to the C$920M after-tax project NPV calculated in the UFS. I will therefore use NAV or P/NAV when discussing the industry framework and the Lassonde Curve, and NPV or P/NPV when applying that framework to Atlas or referring specifically to project-level value. In this case, for all practical purposes, the concepts are broadly interchangeable.
Pierre Lassonde, co-founder of Franco-Nevada, popularized this pattern in the 1990s.101 A mining project’s market value tends to move through a recognizable curve: a speculative spike at discovery, a long valley through feasibility and permitting, a re-rating at financing, another at first production, then gradual convergence toward 1x NAV as operating history accumulates. The valley in the middle has a name: the orphan phase. Too late for drill-hole speculation, too early for institutions that cannot buy pre-production stories. A strange place to be. Often a very good one.
It is not some kind of model pulled from an average of observed mine valuations. It is a real process governed by economic and psychological laws. Put more simply, it is a discovery rather than an invention. Through this framework, the valuation ranges have become well known, even though the exact bands vary depending on the source, commodity, jurisdiction, and cycle. A first economic study, what the industry calls a PEA (Preliminary Economic Assessment), usually gets a project to a P/NAV range of approximately 0.3x to 0.5x. A completed Feasibility Study, with bankable engineering and a visible permitting path, tightens the band to around 0.5x to 0.6x P/NAV.102 Construction moves the multiple higher again. At first production, a new class of investors becomes eligible to buy, and the stock can start trading less like an option on a mine and more like the mine itself, valuation can then begin to converge toward 1x NAV.103
Here’s the Lassonde Curve:
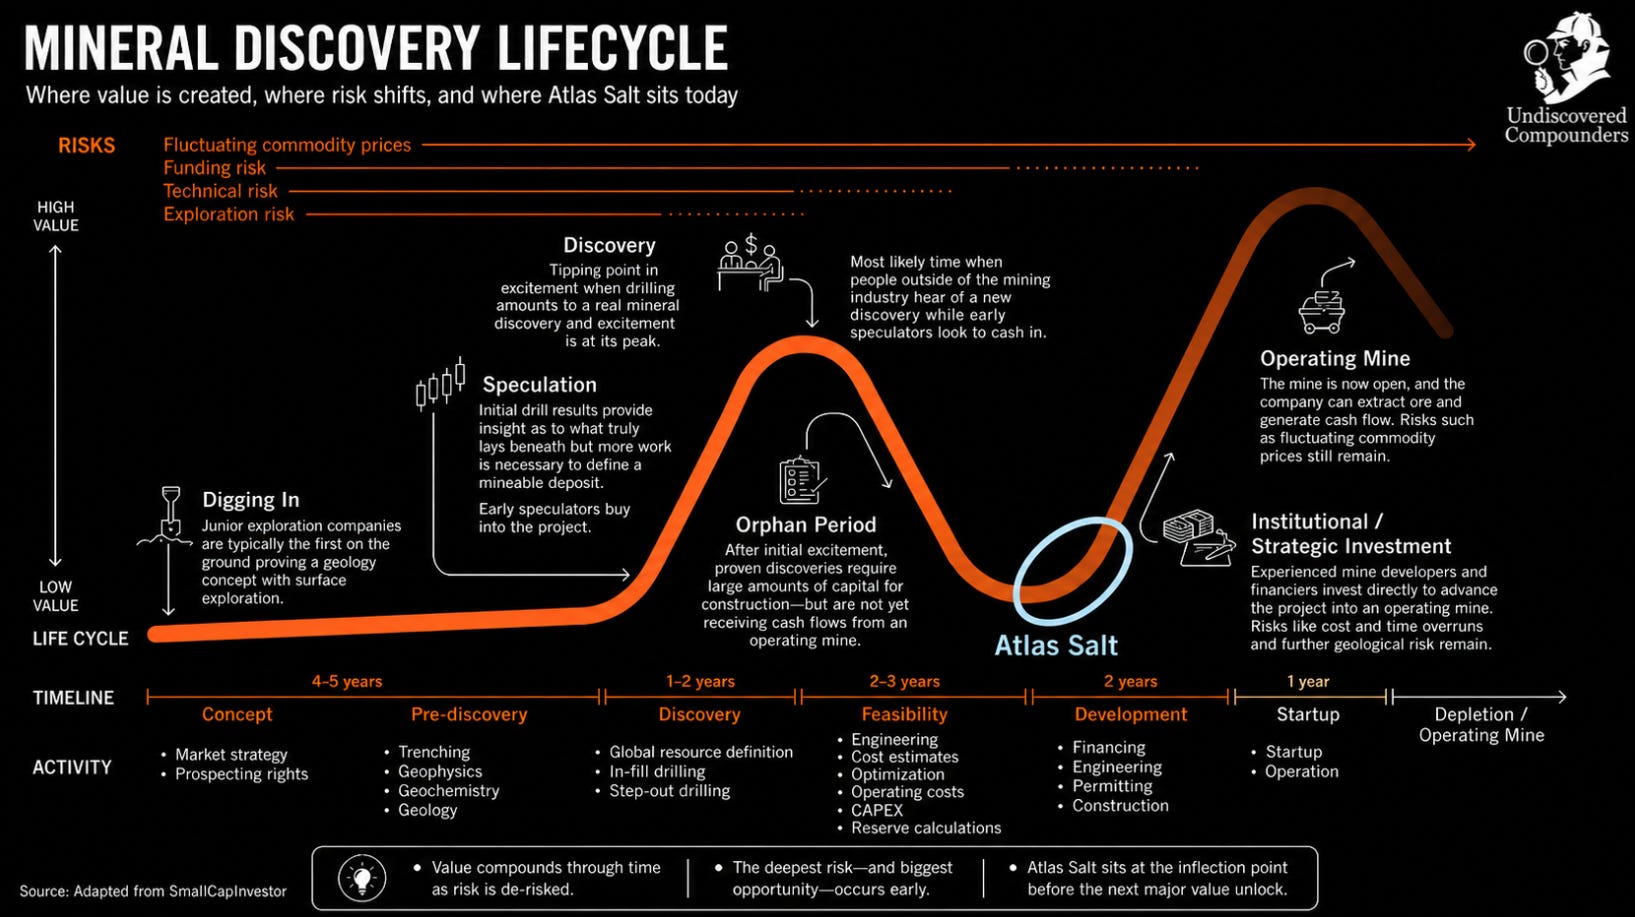
Let’s transpose it to Atlas’s market cap.
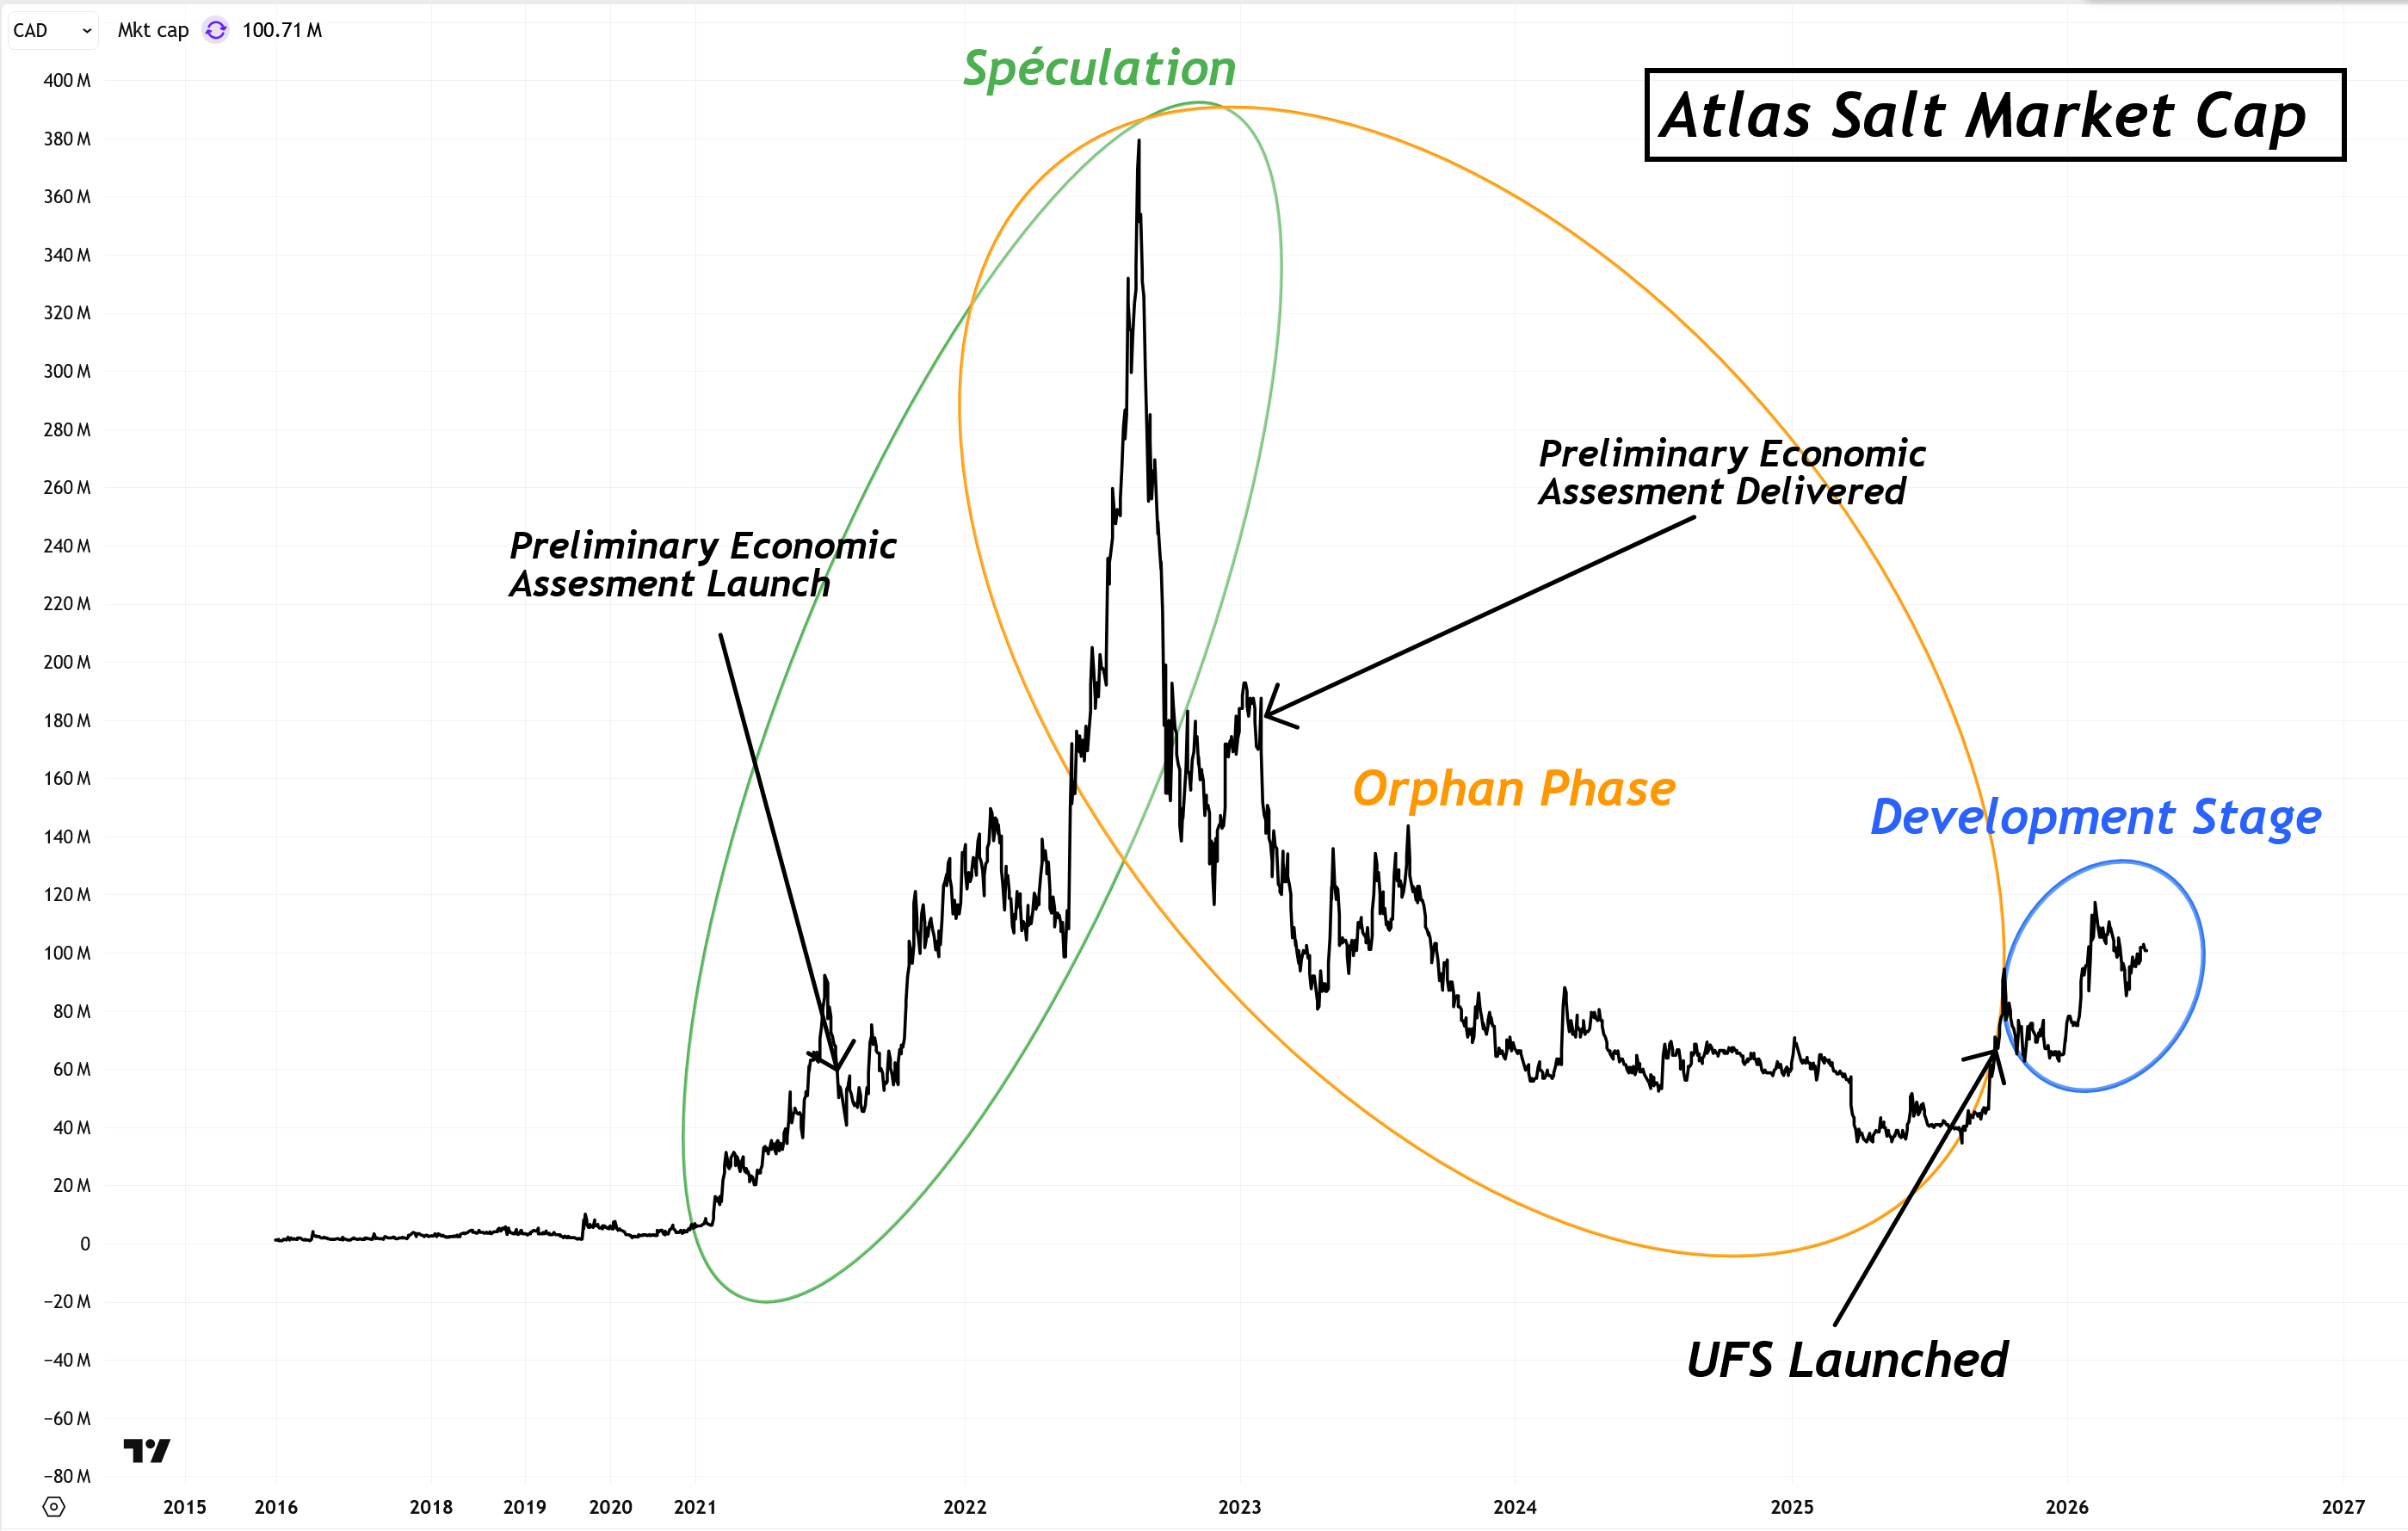
Three phases are visible. The speculative spike from late 2020 through mid-2022, triggered by the PEA launch and delivery, took Atlas from approximately C$5 million of market cap to C$380 million. A 36x move in the stock two years, after dilution (a 75x in market cap). Then came the orphan phase. From 2022 through late 2025, the stock ground lower for three years as the project matured and the market lost interest. This is classic junior mining cruelty: the asset got better while the share price got worse. Since late 2025, the first signs of a re-rating have appeared. Market cap moved off the lows, from approximately C$35 million toward C$120 million, as the UFS landed and Early Works began on site.
Atlas has crossed the dead zone of the Lassonde curve and reached the stage where the market starts asking a different question. For three years, Great Atlantic was a strange industrial mineral project with a study attached. Today, it is a major-permit-cleared project with a completed feasibility study, Early Works underway, and project financing in process.
That alone could form the basis of a thesis: a project leaving the orphan phase and already beginning to re-rate. The problem, or rather the opportunity, is that the curve implies a valuation Atlas has not yet reached. That is the second source of upside.
There is one honest caveat. The 0.3x to 0.6x P/NAV developer range is drawn mostly from gold, copper, and base-metals juniors. Industrial minerals developers are rarer and less familiar to investors. That could justify using the low end of the range for Atlas.
But the caveat cuts both ways. The fact that most developer comps are gold and copper says more about the availability of comparable companies than about the right multiple for an industrial-minerals asset.
In gold or copper, a project trading at a P/NPV of 0.1x on the eve of construction usually says something ugly. The market has seen that movie too many times. It does not trust the project, the numbers, or the team. That is statistical learning at work.
Salt does not have that history in public markets. A listed mining company whose only current business is developing a salt mine, with no operating asset and no precious metal angle, is nonexistent in North America. The closest historical reference I have found is Malagash, Canada’s first underground rock salt mine, developed in Nova Scotia after drilling began around 1917 and the mine opened in 1918. That was another era. Almost nobody in today’s investor base has a mental model for this. Statistical learning is complicated when the sample size is basically zero. Most investors have never had to value a salt mine, think about road salt pricing, analyze the evolution of deicing salt supply and demand, or ask why this project might be simpler than the mines they already know. That is why I decided to spend hundreds of hours of my time on deicing salt.
Put that aside for a moment and look only at the mining and economic characteristics. Deicing salt prices have compounded at about 4% annually for decades, with limited drawdowns and occasional sharp spikes when supply tightens. Gold would envy that pricing profile. The mine itself is structurally simple: shallow deposit, no metallurgical processing, no tailings, short flowsheet. By my reading, Atlas belongs at least in the middle of the 0.3x to 0.6x P/NPV range, maybe near the top.
Seen through the Lassonde curve, Atlas is the archetypal orphan: single asset, single jurisdiction, TSXV listed, industrial mineral, almost no sell-side coverage (the only existing coverage is one month old), and no obvious generalist institutional bid. Most junior mining portfolio managers will not own what they do not know exists. Most small-cap generalists will not touch it because Atlas is pre-revenue. A salt major has little reason to move before the asset is further de-risked. The stock has few natural buyers, except the handful of investors who specifically hunt for this profile.
Two forces point the same way: the curve appears to be turning, and the chart already shows it. Even after that first move, Atlas still trades as if Great Atlantic were several stages behind where it actually sits.
I know, all of this is just valuation by analogy. Every mining project has specifics that can move the real number by thirty percent in either direction, and analogies miss those specifics. The work left is to value Atlas Salt ourselves, as investors who hate losing money do: slowly, with dirty hands.
Quantitative Valuation
The C$920 million headline has already been unpacked. We know what it is: a project NPV, discounted at 8%, built from the UFS mine plan and the costs SLR chose to include.
Shareholders do not really care about what Great Atlantic is worth in the UFS. The final problem, our final problem, is what remains for Atlas shareholders after the missing costs are brought back into the analysis, discounted, financed, and finally divided across the share count that will exist when the mine is funded.
One clarification before the math: the UFS is my starting point, I do not mechanically deduct the same cost line twice. Pre-production CapEx, sustaining capital, operating costs, taxes, royalties, and closure costs are already embedded in the C$920M project NPV. When I adjust them, I do it explicitly as a scenario adjustment: higher pre-production CapEx in bear cases, delay costs, execution leakage, or financing consequences. What follows is therefore the bridge from project NPV to equity value per share: the costs not fully captured by the UFS, the frictions that sit above the project model, and the shareholder-level consequences of funding the mine.
The full mechanics are in the valuation workbook below. I am not going to reproduce every line here. What matters in the text is the bridge: what I deduct, why I deduct it, and what remains before execution, salt price, and dilution.
I separate the deductions into three layers:
First, financing friction. Debt does not dilute, but it is not free. Equity dilutes, and the price matters more than the fee. Bridge capital will be needed before the main package closes. None of this is included in the UFS NPV.
Second, the cash items outside, or not fully captured by, the UFS: working capital, and the corporate costs that continue above the project model (public company costs, board, audit, listing, IR, head office, etc.).
Third, the bucket that cannot be modeled cleanly: FX drift, future approvals, rights of way, port leakage, drilling, small permitting costs, and the other items that never deserve their own heroic spreadsheet tab but still deserve a haircut.
Only then do we get an adjusted NPV. That adjusted number becomes the base for the next step: execution, delay, salt price and finally dilution.
Methodological point before moving on: every number below (unless explicitly stated) is a present value. The final per-share value is therefore a value today, not a future share price after the mine is built.
To stay consistent with the UFS, I kept the September 30, 2025 valuation anchor. Strictly speaking, time has passed since then. At an 8% annual discount rate, rolling the model forward by six months would add about 4% to the values shown below, all else equal. I am leaving that aside to keep the methodology clean and anchored to the UFS date.
So the numbers that follow are slightly conservative on timing alone.
Start with the cash outflow.
Financing Costs
This is the most expensive missing layer, and the hardest one to model cleanly. So we need to spend a little time on it.
Atlas needs cash to build the mine. I size the financing package around a C$625 million starting funding need: the C$589.1 million UFS pre-production CapEx, plus approximately C$36 million of working capital and corporate cash needs outside the UFS through the construction/start-up window (see Financing section), before scenario-specific CapEx overruns and before the cost of arranging the capital itself. That cash will come with costs attached. I do not deduct the debt raised or the equity contribution as a separate cost, because the capital expenditure they fund is already inside the UFS NPV.
“Costs attached” is the polite version. This is finance. Everyone takes a bite: bridge interest, PIK interest, cash interest, lender fees, equity issuance costs, entry and exit fees, advisory costs, legal costs, and closing costs. Some of those costs are paid in cash. Some are capitalized into the debt. Either way, they reduce what reaches the common shareholder.
The first problem is obvious: Atlas has not published the final financing structure or drawdown calendar. Since those costs have to be discounted, timing matters. A lot actually. The same nominal C$500 million of debt is not the same instrument if it is drawn late, drawn upfront, or allowed to accrue as PIK during construction. Financing is path-dependent, so the model has to make assumptions.
My base framework is simple. Atlas raises bridge financing first, before the main project-finance package closes. The bridge is the toll between early works and the moment senior lenders are finally willing to close. It is repaid once the full package is available. The main package is then split between senior debt, vendor financing from Sandvik, subordinated debt, and equity.
I treat senior debt and vendor financing together for leverage purposes. The economics still differ. Sandvik vendor financing would be equipment-backed, operationally aligned, and probably less punitive than pure project debt. But for the common shareholder, both sit ahead of equity and both absorb part of the project’s debt capacity.
From there, I build three cases: bull, base, and bear. For readers who want the mechanics, the full financing model is in the accompanying file above. I am not going to turn this section into a loan schedule, but here is a summary of the scenarios.
The model requires simplifications. I give Atlas no credit for government funding, no credit for incremental financing-related tax shields, and I do not roll forward the UFS NPV from Q3 2025. I do not try to offset the conservative shortcuts, but I partly offset favorable shortcuts with higher debt costs where appropriate. Again, the assumptions are all in the file.
The financing sheets are built on adjusted CFADS, or Cash Flow Available for Debt Service. That means timing matters twice. First, because earlier cash flows are discounted over fewer years. Second, because those same cash flows determine how quickly Atlas can repay debt. Every additional dollar of revenue pulls repayment forward and reduces financing friction. Every additional dollar of cost increases the funding need, extends repayment, or both.
The result is a present value financing friction of:
Bull: -C$147.7M
Base: -C$240.0M
Bear: -C$325.6M
Yes, that is large: 16% of the UFS NPV in the bull case, 26% in the base case, and 35% in the bear case. Everyone gets paid before the shareholder. In the bull case, the project can still send some cash to shareholders while debt is outstanding. In the bear case, the cash sweep effectively says: lenders first, equity later. This also does not include dilution from the equity raise. That comes later. This section only charges the financing friction attached to funding the mine.
This is, by far, the largest cost layer outside the UFS.
I actually think my bear case is probably too bearish. These look more like the terms lenders would demand from a volatile metals project with a difficult build, not from a simple salt mine selling an essential commodity with something close to a built-in price floor. The MOUs and LOIs are already a strong hint of that. If I were underwriting only what I think is most likely, my bear case would sit only slightly below the current base case, the bull case would stay where it is, still with no credit for government funding, and the new base case would land somewhere in between. But the point of this exercise is to survive being wrong. So I still underwrite the genuinely bad case.
The next deductions are smaller.
Working Capital and Corporate Overhead
That C$625 million number sizes the financing; it does not charge the working-capital balance or the corporate cash items themselves. So if working capital and residual corporate overhead sit outside the UFS economics, they still need to be deducted from the project NPV. That is value shareholders cannot use.
Working Capital
Working capital is cash locked in the business. It comes back at the end, but it loses value on the way.
It is made up of receivables from customers paying after delivery, finished product sitting at the port, consumables, and payables offsetting part of the balance. It therefore grows with revenue.
I model it as a percentage of annual revenue, using 8% in the bull case, 10% in the base case, and 12% in the bear case. The cash impact is only the annual change in that balance. If revenue rises, Atlas has to lock up more cash. If revenue falls, cash is released. At mine closure, the remaining working capital is released back into cash, but with far less value.
Using the UFS revenue schedule as the timing base, with each case’s revenue curve from the DCF, discounted at 8%, this gives:
Bull: -C$32.6M
Base: -C$32.4M
Bear: -C$33.8M
The result looks counterintuitive at first: Base < Bull < Bear, with all three clustered around the same range. The reason is simple: working capital is the toll paid on growth. Each additional percentage point of working capital destroys about C$4.1M in the bull case, C$3.2M in the base case, and C$2.8M in the bear case. Combine those different working-capital rates with different revenue curves, and the order gets messy. In the end, the conclusion is still the same: approximately C$33M of value disappears because cash comes back too late. Who said time is money again?
Now to “real” expenses.
Residual Corporate Overhead
Here I am not adding mine G&A again. The UFS already includes project-level operating G&A and the people needed to operate Great Atlantic. What I am reserving for is the residual listed-company layer above the project: board, audit, listing fees, IR, head office, financing readiness, and the general cost of remaining public while the mine moves from study to construction to first cash flow.
I model that layer at C$3.0M / C$3.5M / C$4.0M per year during construction, in line with the normalized corporate burn discussed in the Financing section. Once the mine is producing, I step it down to C$2.0M / C$2.5M / C$3.0M. Atlas will still be a listed company, with board, audit, listing fees, etc., but it will no longer be a pre-revenue developer trying to finance and build a C$625M project. I escalate those costs at 2% per year (in line with the UFS cost escalation), and discount them at 8%.
That gives:
Bull: -C$30.0M
Base: -C$36.7M
Bear: -C$43.3M
Together, working capital and residual corporate overhead reduce the NPV by C$62.6M in the bull case, C$69.1M in the base case, and C$77.1M in the bear case.
Residual Risk Reserve
Here we are firmly in the artistic part of the exercise. I have to reserve for risks that are, by definition, not precisely estimable.
SLR lists a series of exclusions from the capital cost estimate. Here they are.
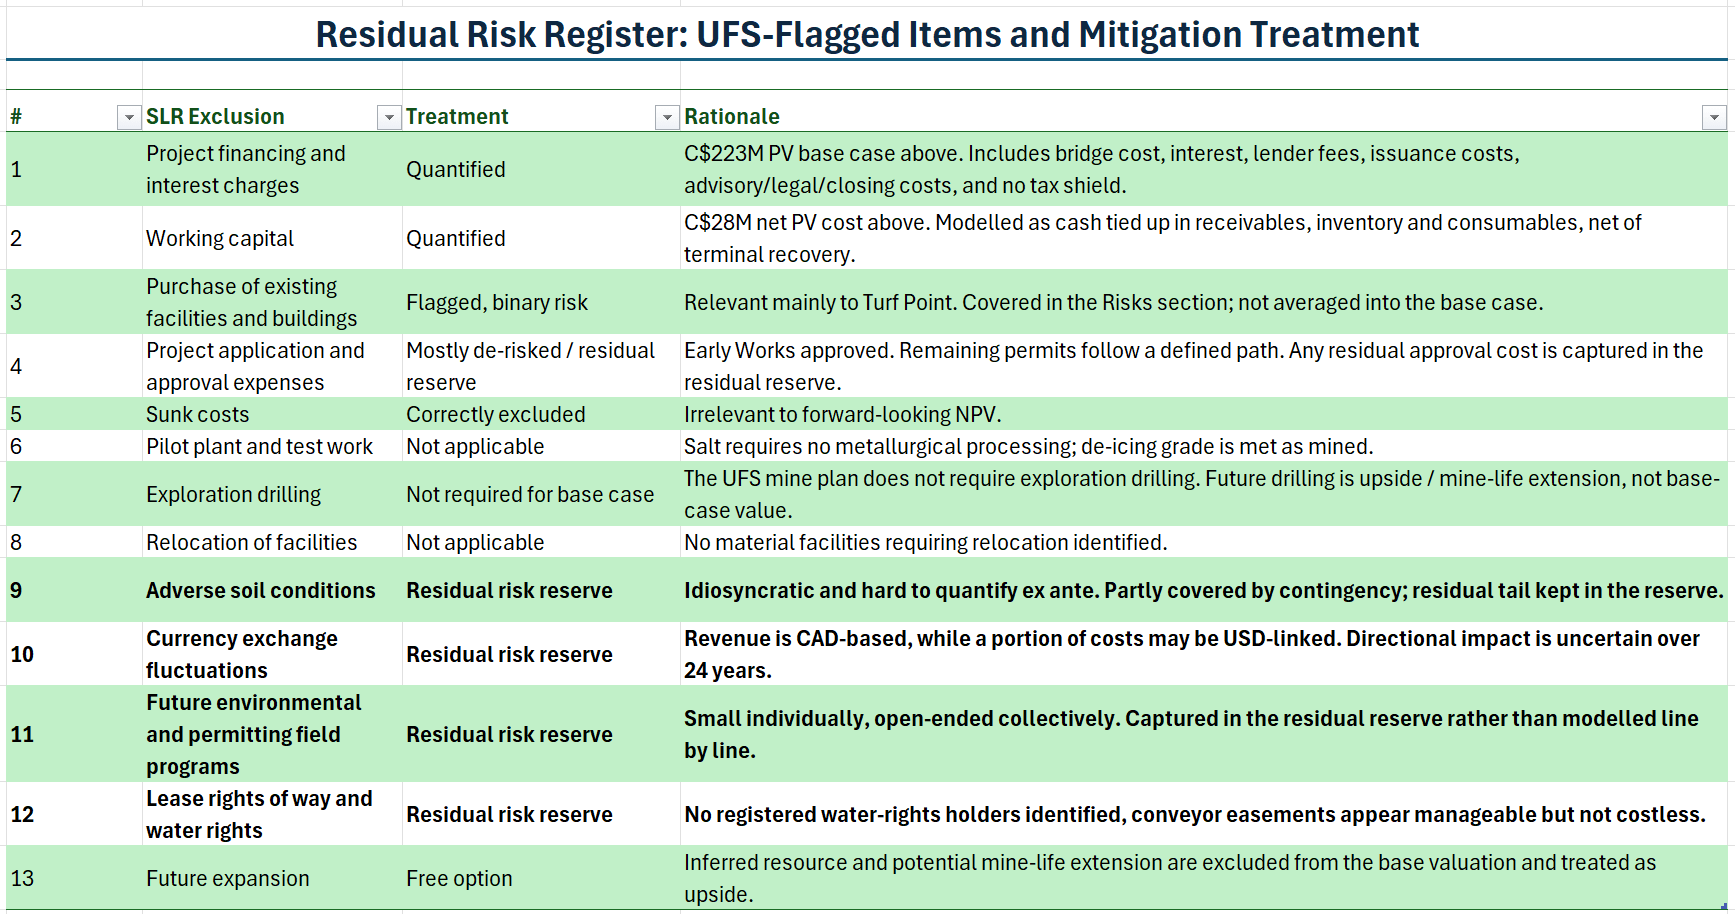
Some have already been quantified above. Some represent upside I do not underwrite. Some are either not applicable or already handled elsewhere in the model or by the company. One known item is the geotechnical / hydrogeological program explicitly excluded from the UFS capital estimate. I keep it inside my residual-risk reserve at a fixed C$3.0M (the amount disclosed in the UFS). What remains is the undefined tail.
I am not going to build a tab for each of them. The data is not there, and the precision would be fake.
One item deserves a separate note: currency. It can hurt Atlas, but it can also help. The UFS is built in Canadian dollars, while some equipment, services, shipping, and contractor costs may be exposed to the U.S. dollar. A weaker Canadian dollar can raise those costs. But if part of Atlas’s realized pricing is U.S.-dollar-linked, or set by import-parity pricing against foreign supply, a weaker Canadian dollar can also help the revenue side in Canadian-dollar terms. That is why I do not force a large residual reserve into the bull case.
I apply a valuation reserve directly against the UFS NPV: 1.5% in the bull case, 3.5% in the base case, and 5.5% in the bear case.
This gives:
Bull: -C$13.8M
Base: -C$32.2M
Bear: -C$50.6M
That closes the cost pre-execution bridge.
Put together, the pre-execution cost bridge takes:
-C$224.1M out of the bull case,
-C$341.3M out of the base case, and
-C$453.3M out of the bear case.
The C$920M UFS NPV becomes C$695.9M, C$578.7M, and C$466.7M before execution, the separate salt price / mix adjustment, and dilution.
As a reminder, Atlas Salt trades at approximately C$120M of market cap. We still have room in the bear case. Good, because there is more value left to consume.
Execution
This is the last large project-level risk Atlas Salt will carry until the first tonne reaches the port.
SLR knows it, which is why the UFS budget already contains a cushion. SLR’s pre-production CapEx is C$589.1M, but that number includes C$77.5M of contingency on top of a C$511.6M subtotal. Contingency equals approximately 15% of the pre-contingency estimate. So the first layer of construction disappointment is already inside the C$920M NPV.
I break execution into 5 variables:
Initial CapEx overrun
Sustaining CapEx overrun
OpEx overrun
Delay
Ramp-up miss
Case by case.
Bull Case
In the bull case, the contingency does its job. The project is built inside the UFS envelope, on the UFS schedule, and ramps as planned. One could add back part of the contingency to NPV if everything came in perfectly. I do not include it, as I view it as too unlikely.
Execution haircut: C$0M.
Base Case
In the base case, the mine is still built, but the build is messier than the feasibility study assumes. Initial CapEx and Sustaining CapEx come in 15% above the UFS budget, OpEx overruns by 10%, first production slips by one year, and the ramp-up is a little slower than planned.
Initial CapEx overrun. The extra 15% takes initial CapEx from C$589.1M to approximately C$678M. Since the UFS number already contains contingency, this is heavier than it looks: C$678M is approximately 32% above the pre-contingency estimate. Using SLR’s capital-cost sensitivity, I charge C$54.3M against project NPV.
Sustaining CapEx overrun. The UFS carries C$609.1M of sustaining CapEx over the mine life, more than the initial build in nominal dollars. A mine that costs more to build can also cost more to keep running. In the base case, I assume 15% sustaining CapEx drift. Discounted over the mine life, that removes C$27.0M of present value.
OpEx overrun. Operating cost also drifts. The UFS models C$28.17/t shipped FOB Turf Point. That is a good starting point, but as we saw in the risks section, labour, maintenance, contractors, power, port handling, and general underground operating discipline all have room to move. I charge a 10% OpEx overrun, using my interpolation of SLR’s OpEx sensitivity as the conversion table. That removes C$52.7M of NPV.
Delay. I take one year. SLR models a 48-month pre-production period, so one year is a 25% schedule slip. The delay haircut is C$58.3M. I apply the delay after the cost variances, because there is less value left to delay once CapEx, sustaining CapEx, and OpEx have already taken their bite.
Ramp-up. I charge C$20M. The UFS already assumes a three-year ramp to nameplate, so this is only a timing penalty: fewer tonnes early, slower customer conversion and weaker operating rhythm in the first years.
Base execution haircut: -C$212.3M.
That is the normal ugly case, the usual translation from feasibility study to the ground.
Bear Case
This is where I bring in the mining reference class.
McKinsey’s 2024 review of mining project delivery found that, over the past decade, major mining projects suffered average real cost overruns of approximately 40% and average real schedule delays of approximately 25%. Larger projects did worse, and the type of extracted material was one of the variables that mattered most.
As discussed earlier, Great Atlantic sits on the simpler end of the mining spectrum. Its construction file is mostly underground access, material handling, storage, and port logistics, rather than a metallurgical processing plant, a concentrator, a tailings system, or a shaft. The remaining risks are more… prosaic: decline advance rates, water management, contractor productivity, conveyors, commissioning, and the first operating rhythm. They can still cost time and money. They just give the project fewer ways to go wrong than the average mine in McKinsey’s sample.
Still, the bear case has to hurt.
Initial CapEx overrun. I assume a 30% overrun on the UFS initial CapEx number. This is not a direct SLR sensitivity point, so I use SLR’s capital-cost sensitivity as the conversion factor. The overrun takes Initial CapEx from C$589.1M to approximately C$766M, or approximately 50% above the pre-contingency estimate. I charge C$108.7M against NPV.
Sustaining CapEx overrun. I assume 25% drift. The remaining sustaining risk is mechanical: new levels, fleet rebuilds, conveyors, underground infrastructure, and maintenance. Discounted, that removes C$44.9M. Note that the impact is limited because those expenses sit far in the future and are therefore heavily discounted.
OpEx overrun. I assume 15% drift. Labour, maintenance, contractors, power, port handling, and insurance compounding above the UFS line escalation. That removes C$79.1M.
Delay. I take eighteen months. On a four-year construction schedule, that is 37.5% slippage, already worse than McKinsey’s mining average, applied to a project that should be easier than the average mine. After the cost variances already charged, the present-value cost is C$75.0M.
Ramp-up. I charge C$50M. This is the least precise line, so I keep it as a proxy. Against SLR’s production-loss sensitivity, it is equivalent to 2.5 points of additional production-loss effect.
Bear execution haircut: -C$357.7M.
Putting all the cases together, we get this:
Bull: -C$0M
Base: -C$212.3M
Bear: -C$357.7M
Now put execution back into the full pre-price-adjustment bridge. After financing friction, working capital, corporate overhead, residual risk, and execution variance, the C$920M UFS NPV becomes:
Bull: C$696M
Base: C$367M
Bear: C$109M
In the bear case, almost 90% of the UFS NPV is consumed by costs. But there are still two more variables to account for. The two variables that required more than 20,000 words, several hundred hours of work, and that sit at the heart of this opportunity: the price of salt and the product mix.
Salt Price
This is the most important part of the deep dive. So before touching the model, let me restate the market.
The North American rock salt market is structurally short. It has to import 8 to 10 Mtpa of deicing salt, most of it into the East Coast, often from less reliable offshore supply chains. Domestic supply is tight too, with several incumbents already under pressure. Demand has a floor because public agencies must hold minimum inventories. Every winter, municipalities, private contractors, and retail buyers need deicing salt. Consumption can vary with weather, but the need does not disappear. Mild winters mostly shift the timing of replenishment while severe winters expose the shortage immediately.
That shows up in price.
Over the last forty years, U.S. rock salt PPI has compounded at 4% per year. According to Atlas Salt’s investor presentation, the actual historical price CAGR would be approximately 4.2%, with very limited drawdowns, and shallow ones when they happen. That is before looking at the spot market, which can spike violently when winter stress meets tight inventories. During the 2025-26 winter, spot prices tripled in some regions, just as they had the winter before. Those spikes do not vanish when the snow melts. Empty depots have to be refilled, buyers remember who delivered and who did not, and part of the spot pressure flows into the next contracting cycle.
Atlas also has a mix angle. Only about 35% of planned production is currently covered by the Scotwood non-binding MOU, and management wants to push a meaningful portion of volumes into retail through that relationship. Retail is a different market from bulk municipal salt, and Atlas could earn materially higher margins there than in bulk, depending on the final JV economics
Finally, climate change changes the pattern of use. More freeze-thaw cycles, more freezing rain, and more unstable winter events. More salt will be consumed at the wrong time, in the wrong place, and less predictably, in a market that already runs on tight flows. Atlas is the only new North American salt mine with a completed UFS and Early Works underway in twenty-five years.
That is the state of the North American deicing salt market, and that is the price backdrop we are valuing.
With that market in mind, now take the UFS price curve.
SLR escalates the rock salt price at 4% per year for five years from the base date, and 2% per year thereafter. The starting point is defensible, but the fade to 2% is where I completely disagree. Not if we take into account everything above.
My base case is obvious: 4% CAGR. That is the reality of the last several decades. I use 5% CAGR in the bull case and 3.5% CAGR in the bear case. Why not simply use the UFS’s price curve, at least for the bear case? Because that is where the alpha sits. A 2% CAGR strikes me as absurdly low relative to any reasonably plausible scenario. As a shareholder, I am not trying to prove that Great Atlantic Salt can work under a sterile feasibility-study curve. I am trying to estimate the distribution of outcomes as close to reality as possible, because that distribution determines what I am being paid for the risk I take. A 3.5% CAGR is already a hard underwriting line. It assumes a historically low price trajectory, without giving credit to a single one of the factors discussed above.
So, what does this do to NPV?
For each year, I compare my price index to SLR’s price index, apply that ratio to UFS revenue, and then convert the PV-weighted price difference into after-tax NPV using SLR’s own salt-price sensitivity. In the UFS, a 10% increase in the LOM salt price adds C$188.6M of after-tax NPV8. Put simply, I applied the UFS-measured impact of a 10% increase in salt prices to my bull, base and bear cases using linear interpolation.
That gives:
Bull: +C$753.5M
Base: +C$392.9M
Bear: +C$233.5M
The bear case adds C$233.5M to NPV. The base case adds C$392.9M, and the bull case adds C$753.5M.104
This is why the opportunity starts where the UFS stops.
Take a seasoned mining investor. They read the UFS, take SLR’s assumptions, run the same risk math I did, then run the dilution math, and think: “No. Too far-fetched, not enough margin of safety. I’ll pass.” Fair. They have seen hundreds of gold, copper, or uranium projects. They have seen cost overruns, broken studies, optimistic ramp-ups, and shareholder dilution disguised as progress. What they have probably not seen is a salt mine. No comparable new rock salt mine has opened in North America in twenty-five years. No pure-play publicly listed salt mine developer that has gone through this exact path in decades. There is no mental model sitting on the shelf. It is simply the result of hundreds of hours of work spent understanding the Eastern North American deicing salt industry and Atlas Salt’s place within it.
The market gap is therefore partly educational. Atlas needs investors to understand what kind of asset they are looking at.
The CEO deserves credit here. Over the last few months, he has been speaking at many conferences and investor presentations, trying to educate investors on Atlas and on the salt market. That is how I found the company in the first place. In the very short term, this is probably the best way to unlock value. The story is there. It is just buried under the unfamiliar. Undiscovered, in the literal sense.
Shareholders can only hope he keeps doing it over the coming months, before the heavy work really begins.
There is still a limit to what management can say. What are they supposed to do? Stand up and say: “SLR completely underestimated the salt price, our NPV should be 40% higher, believe me”? In a sector where everyone is suspicious, they would lose credibility immediately. Probably with good reason.
My position is different. I am not management. I do not get paid to convince anyone to buy the stock. I invested based on these numbers myself. The assumptions are laid out. The model is visible. The sources are there. All I have done is collect the information, organize it, and show the math. Anyone putting money at risk should verify the work independently.
Once I replace SLR’s long-term 2% fade with a price curve that better matches the salt market, the rest of the model becomes much easier to underwrite. The thesis can absorb an eighteen-month delay, a mine built about 50% above the pre-contingency estimate, and still leave out the 288 Mt of additional Indicated Resources and the 868 Mt of Inferred Resources not included in the mine plan, possible low-cost government funding, higher retail margins, and everything else that could still go right.
There is still one more source of potential upside to address: the sales mix.
Sales Mix
The UFS assumes Atlas sells into four buckets:
U.S. East Coast: 56.0%, or 2.24 Mtpa
Canadian Maritime Provinces: 8.5%, or 0.34 Mtpa
Québec: 15.5%, or 0.62 Mtpa
Spot sales and commercial: 20.0%, or 0.80 Mtpa
That gets Atlas to the full 4.0 Mtpa production rate. SLR then converts that destination mix into a weighted-average price of C$81.67/t FOB Turf Point. So, regardless of whether the physical sale is CIF, DAP, or FOB, the economic model brings everything back to one FOB Turf Point price (see Section 4). In other words, the UFS collapses geography, channel, contract structure, and product format into one number. Clean? Yes. Lendable? Yes. But too clean for a shareholder.
The UFS treats Atlas mostly as a bulk supplier selling into destination markets at a normalized FOB-equivalent price. It allocates 20% of volume to spot sales and commercial. That line alone is 0.8 Mtpa, and it is explicitly not the same animal as bulk public-sector tonnes. Yet, once the economics hit the model, everything still gets compressed into C$81.67/t FOB. That is where I think the UFS leaves value on the table.
Scotwood had already signed a non-binding MOU with Atlas that contemplated 1.25 to 1.5 Mtpa of volume through a Canadian retail / packaged-salt partnership. Against the 2023 mine plan, that was approximately half to 60% of planned production. Against the new 4.0 Mtpa UFS plan, it is still 31% to 37.5% of annual volume. According to my estimates (see Section 4), if 1.5 Mtpa eventually earns C$60-80/t of incremental economics above the bulk FOB case, that is C$90-120M of annual pre-tax economics before discounting. Over the mine life, discounted at 8%, with no additional price escalation, that rough math gets to around C$630-840M of present value after leakage and taxes.
And Atlas does not see that as the ceiling. Management has said it is discussing a larger retail/distribution allocation with Scotwood and other distributors, which would increase the share of that channel and could push it close to, or even above, half of the sales mix. The company has also mentioned selling directly into Newfoundland and Labrador, where logistics are shorter and Atlas could be able to capture more of the downstream margin itself. So the gap is clear: the UFS still treats most of Atlas’s volume as bulk road salt, while Atlas is actively trying to move a larger share of its salt into higher-margin channels.
Management has both the ability and the incentive to push more salt into higher-margin channels. The fact that the largest packaged retail deicing distributor in the United States approached a junior developer six years before first production tells me the UFS mix is likely too conservative. But it is still only a signal. There is no proof. There is no binding contract. Good. If the risk had already disappeared, the valuation would not look like this.
For me, the bear case is boring bulk economics. And that is essentially what the UFS modeled. So my bear-case starting price is C$81.67/t, the UFS FOB Turf Point price.
From there, I built the base and bull cases. Instead of blindly stacking assumptions around unknown channel mixes and unknown price points, I kept the UFS price as the anchor: C$81.67/t. Then I added a simple mix-driven uplift: +C$5.83/t in the base case, and +C$13.33/t in the bull case:
Bull: C$95.00/t
Base: C$87.50/t
Bear: C$81.67/t
That is not aggressive. At 4.0 Mtpa, the base case uplift is only C$23.3M per year before escalation. Using the C$60-80/t Scotwood economics, that is the equivalent of only 0.3 to 0.4 Mtpa of higher-margin volume, spread across the whole 4.0 Mtpa production base. The base case only assumes a small amount of channel improvement leaks into the FOB-equivalent realized price.
Same idea for the bull. C$53.3M is still below the C$90-120M/year that a full 1.5 Mtpa Scotwood outcome could imply. Even the bull case only captures the equivalent of approximately 0.7 to 0.9 Mtpa of the 1.5 Mtpa (based again on the C$60-80/t channel economics).
Now the mix-only DCF impact.
That gives105:
Bull: +C$430.8M
Base: +C$162.7M
Bear: C$0
The bear case has no sales mix uplift. The base case adds C$162.7M from mix. The bull adds C$430.8M. In all three cases, the full Scotwood math remains mostly outside the model. Any expanded Scotwood allocation, any new retail / distribution partner, any higher spot allocation, and any local direct-sales margin are also outside the model. This is not heroic conservatism; it is just the only way to handle uncertainty when both the probability and the economics are still impossible to pin down.
The final adjusted shareholder NPV before dilution now looks like this:
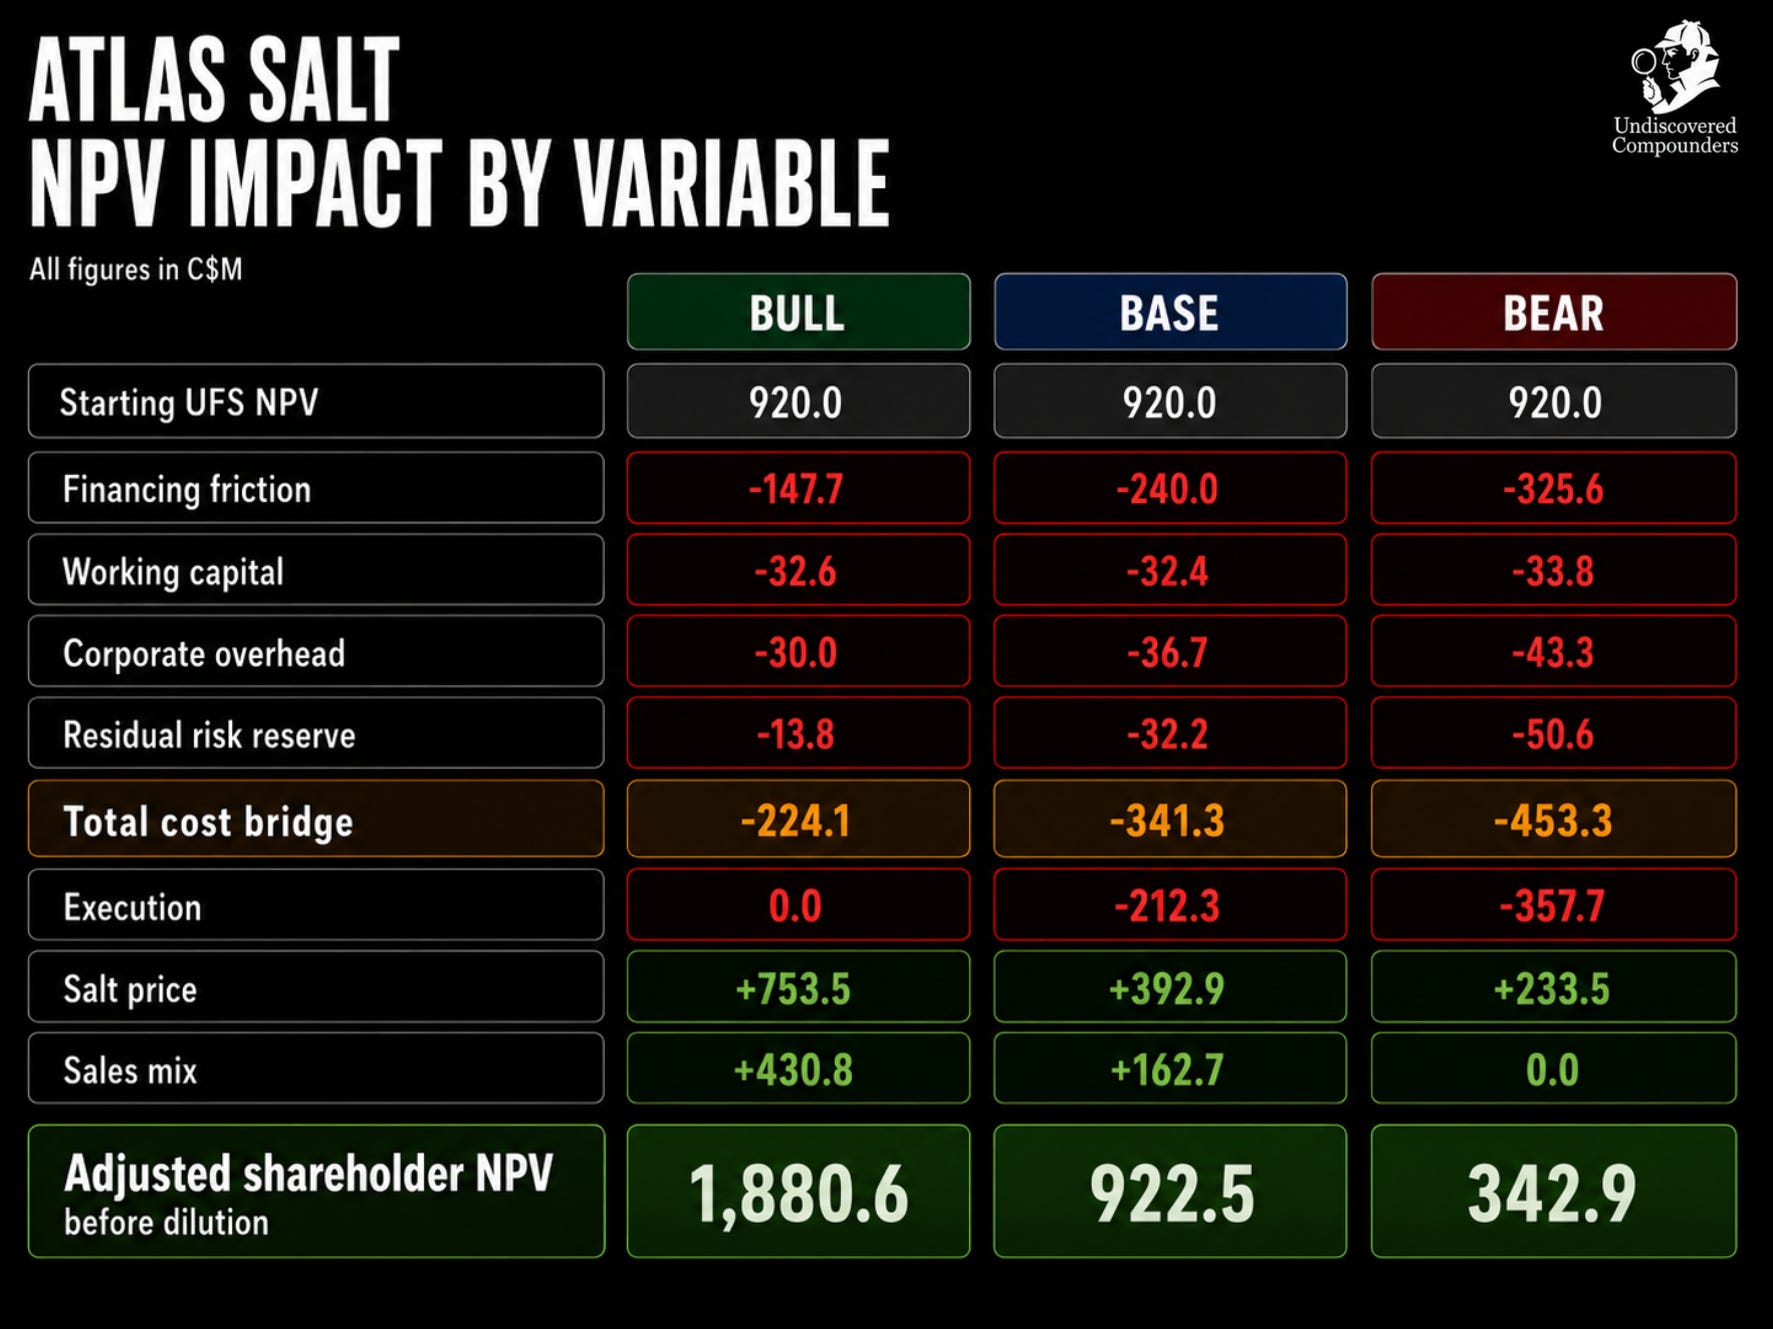
In the bull case, the cake is enormous. Even in the bear case, there is still significant cake.
But one final question remains: how many slices will the cake have to be cut into?
Dilution
Great Atlantic is too large for the current balance sheet. The UFS pre-production CapEx is C$589.1 million, before the shareholder-level layers added in this model. Atlas can reduce the equity cheque with senior debt, vendor support, subordinate debt, and a bridge facility, but it cannot eliminate it.
I start from the fully diluted share count. Basic shares are approximately 110.7 million. Fully diluted shares are approximately 119.6 million. The current option, RSU, PSU, DSU, and broker-warrant stack is already inside that number, so I use it as the denominator from the start. I then add two small reserves on top: a financing sweetener for warrants or similar instruments needed to clear the construction equity raise, and a future SBC reserve through first production. The SBC reserve is modeled as a percentage of the final diluted share count. I also give no credit for possible cash proceeds from future option or warrant exercises.
In the execution layer, I charge cost overruns on top of the UFS pre-production CapEx number, which already includes the 15% contingency: an additional 15% in the base case and 30% in the bear case. These overruns also have to be financed, at least partly with equity. OpEx and sustaining CapEx overruns are assumed to be funded from operating cash flow. They reduce CFADS and slow debt repayment in the financing model, but they do not create additional construction shares.
I do not assume the entire overrun is funded with equity, that would be too blunt. I also do not assume senior lenders simply increase their exposure on the same terms, that would be too generous. In the base case, 40% of the overrun is funded with junior / cost-overrun debt and 60% with equity. In the bear case, 25% is funded with junior debt and 75% with equity. That adds C$53.0M of equity in the base case and C$132.5M in the bear case. The resulting extra debt and equity then runs through the same constraints as the base financing package: fees, DSCR (debt-service coverage ratio), PIK interest (payment-in-kind), cash sweep, etc. Again, every detail is in the DCF.
Once the base dilution and the dilution caused by a potential CapEx overrun are included, the net construction-equity requirement, before grossing up for issuance fees, is:
Bull: C$125.0M
Base: C$240.5M
Bear: C$382.5M
Great, we have the amount. But at what price?
The main variable is timing: when does Atlas raise, and how much? Before senior financing? After senior financing? After the construction corridor? After a Sandvik conversion? After a binding offtake? Every layer of de-risking should increase the probability of a re-rating, and therefore reduce the number of shares Atlas has to issue for the same amount of cash.
Rather than inventing a full issuance schedule out of thin air, I use a blended issue price across the construction equity for each scenario.
Bull C$2.5: Atlas re-rates quickly and keeps pushing the equity raise further down the curve.
Final diluted shares: 177.2MBase C$1.75: Atlas finances part of the project relatively early, then moves moderately along the Lassonde curve over the following years.
Final diluted shares: 279.9MBear C$1: No real re-rating. The share price even weakens, and Atlas issues shares by the hundreds of millions until the relief of the first tonne shipped.
Final diluted shares: 571.9M
From bull to bear, the share count is multiplied by 3.2. All else equal, that means about 1/3 as much value per share.
This is why the sequence over the next 12 to 24 months is essential. Every binding agreement before the equity raise changes the denominator. Every milestone reached increases the probability of a re-rating and reduces the number of shares issued. Since I started writing this deep dive, the stock has already risen more than 60%, but in my opinion, it is still far from a price that would make equity financing attractive.
I also think management may be making a capital allocation mistake.
In the investor presentation, management suggests that part of unlevered FCF could be returned to shareholders from the first production year. I understand the idea. A dividend can attract a different type of investor, possibly open the door to certain income-oriented funds, and maybe support the share price before a refinancing or a future equity raise. But that is a probability.
What is a certainty, if construction debt is still outstanding, is that every dollar of cash flow paid out as a dividend is a dollar not available for principal repayment. And every dollar of principal not repaid means more interest accumulating. That is arithmetic.
In any case, I doubt the covenants will allow Atlas to distribute that much cash in the first years of production. The only shareholder return that could make sense early would be a buyback, and only if the covenants allow it and if the stock is still obviously undervalued despite production.
Activist moment over.
I have kept you here for 30,000 words. Time to give you what you came for.
How much is Atlas Salt worth?
How Much Is Atlas Salt Worth?
One vocabulary point before moving on: I start from the fully diluted share count. That makes the adjusted NPV per share slightly lower than a basic-share calculation, because the options, RSUs, PSUs, DSUs, and broker-warrant stack is already in the denominator. Run it on basic shares and the per-share value looks higher. But those instruments exist. I prefer to count them from the start.
Here is the DCF summary:
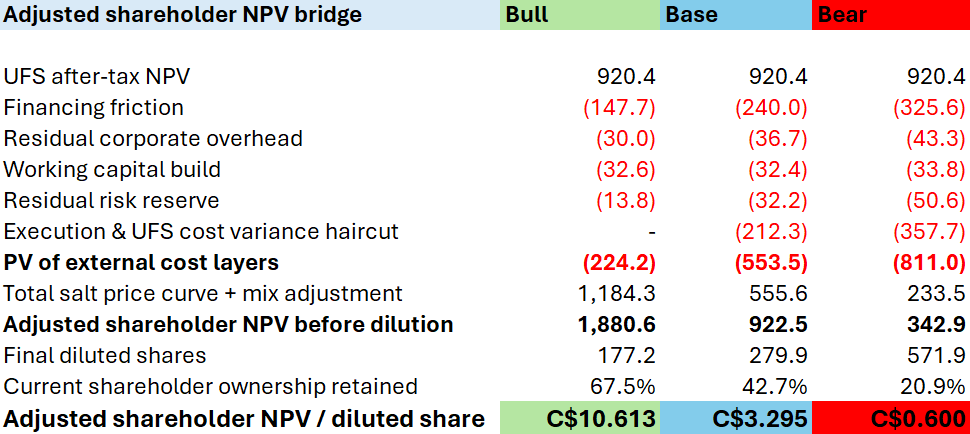
At a share price of C$1.20, the setup looks like this:
Bull case, close to a 9x.
Base case, almost a 3x.
Bear case, down 50%.
These numbers are NPV per share, so they are discounted values, not future share-price targets. Each year, all else equal, the discounting fades and the present value rises.
Of course, all else will not be equal. During the four-year construction period, some milestones will have been reached, some risks will have disappeared, others will have materialized and been quantified. Time reduces uncertainty and risk, but it also reallocates the pie. The longer you wait, the more of the upside, or downside, has already gone to those who were willing to bear the uncertainty.
And this is where the setup becomes more… interesting:
The valuation above excludes several factors that could materially increase intrinsic value. They are the pieces I have deliberately left out throughout this deep dive, framing that choice as “conservatism” or “safety”:
First, the resource. The UFS mine plan is built around 95 Mt of Probable Reserves, but the deposit is much larger: 288 Mt of additional Indicated Resources at 96.0% NaCl and 868 Mt of Inferred Resources at 95.2% NaCl. In most mining projects, that would be too speculative to count, but salt is different. Bedded salt deposits tend to be homogeneous and laterally continuous, and the conversion from resource to reserve is usually far cleaner than in metallic mining.
Second, the sales mix. Atlas has the opportunity to sell part of its salt into channels with margins far above the UFS blended FOB pricing framework. It is actively trying to build that opportunity now through retail partnerships. If the sales mix ends up with 50% in retail/distribution and another 10-20% in local and spot sales, which management appears to be targeting, my bull case for this variable could look like a bear case.
Third, government financing. Any public support would reduce dilution and financing costs, which are by far the largest external cost layer in the DCF. The project has already received a small amount of public funding once, and the province has every reason to want a multi-generational employer in western Newfoundland. It is a big “if,” but also a big “then what?”
Fourth, early production. Atlas has mentioned the possibility of starting production before the first official UFS production year. If that happens: less debt, less interest leakage and higher NPV. Even the bull case assumes Atlas follows the UFS construction path. But if early production becomes credible, the market will not wait until the first full year of production to reprice the stock.
Fifth, the tax shield. I have not credited Atlas for the tax shield created by the extra costs I deduct above the UFS. Some of those costs should reduce taxable income, either immediately or over time. The exact value depends on tax treatment and timing, so I leave it out. Directionally, it is upside.
Sixth, M&A. This is the card I have waited to play since the beginning. My future as an Atlas shareholder may be shorter than the mine life, because Atlas is an obvious potential acquisition target. The likely window is around first production, either shortly before or shortly after, when the project has been de-risked enough for a buyer but before the market has fully capitalized the long-term cash flows. It would also remove several risks from our side of the table. I will come back to this later.
So the model gives us the core of the argument. The omitted upside gives us the shape of the distribution. And the distribution matters more than the point estimate.
My view is that the probability of landing in something equivalent to the base case or better is above 75%, and the probability of landing in the bear case or worse is below 10%. The remaining probability sits somewhere between the bear case and the base case. I am pulling those numbers from my own judgment. There is no formula for this. But for the bear case to become the central outcome, several things need to go wrong at the same time, while many of the things that could go right need to fail to show up.
The main variable in the bear case is the salt price. For that case to become the central outcome, salt prices would need to stay much closer to SLR’s cautious long-term curve than to the forty-year producer-price history discussed earlier. That is hard to reconcile with the structure of the rock salt market: aging supply, shrinking domestic capacity, import dependence, procurement stress, and a buyer base that cannot choose to stop buying when winter hits. In both 2025 and 2026, parts of the market ran short of salt and spot prices spiked. These episodes are starting to look less like “exceptions” and more like the new shape of the market.
Even if salt prices compound more slowly than I expect over the next two decades, Atlas would still have to sell its salt in the conservative UFS mix, with limited benefit from retail or higher-margin commercial channels. That is also not what the company appears to be trying to build.
Even if those two variables land close to the bear case, a lot of other things still have to line up badly: cautious senior lenders, no government funding, no vendor financing, a share price low enough to create heavy dilution, delays and CapEx overruns beyond the UFS assumptions, no early production, and no meaningful offset from any of the omitted upside.
That is a big “then what,” but it needs a lot of “ifs” to get there.
For those who skipped the 30,000 words and think I am being too optimistic: read the full thesis. Every piece above was developed earlier, one by one, number by number.
And even if the bear case materializes and the share price does not give you a clean exit, you can still wait. Once Atlas has repaid the construction debt, the business should be able to return most of its free cash flow through dividends and buybacks. Under the UFS assumptions, once production reaches 4 Mtpa, that means about C$150M to C$200M of after-tax cash flow per year for about two decades. But we will come back to that in a moment.
This is why Atlas may be one of the best risk/reward setups I have come across in my career.
The upside is large, and I think the market is applying the wrong discount. Yes, the risks are real. Yes, there is a real risk of permanent capital loss: a historic earthquake like the 1929 Newfoundland and Labrador event, an armed conflict, name your black swan. But this is no longer the usual junior-mining risk of hoping the ground contains something valuable.
Great Atlantic is shallow. It does not require a vertical shaft. There is no lake sitting above the mine. The product is rock salt, so there is no metallurgical puzzle to solve and no complex processing plant to build. The deposit has been drilled, the salt is there, the end market exists, and the project has already cleared most of the permitting path.
What remains is mostly financing and execution, the two risks no greenfield developer gets to avoid. They can seriously hurt the economics if handled poorly. But they are narrower than the discount suggests. And yet Atlas trades at an NPV multiple one-half to one-third of mining peers that, at a comparable stage, often still carry more geological, metallurgical, permitting, or commodity-price risk.
The second source of the discount is simpler: investors do not know where to put it.
There has been no comparable new salt mine in North America for decades. There are almost no public comps, no futures curve, no liquid benchmark. For mining investors, salt looks too boring, sometimes not even like mining. For other investors, a mine looks too risky. So the asset sits between categories.
You can feel it even at the mining conferences Atlas Salt attends. The questions often start from zero. Sometimes there is almost a smirk in the premise: a company trying to sell rock salt, here, at a mining conference. These are mining people, and even they do not really have a mental bucket for it.
It is undervalued because it is undercovered, and because the risks are clearly overstated, creating potential enormous upside.
What we care about now is how this upside materializes.
11. Repricing
There are only three paths for value to reach shareholders:
The market recognizes the setup before the cash flow arrives.
The mine is built and the cash flow is returned through dividends and buybacks.
Someone buys the asset.
Recognition, distribution, or acquisition.
Recognition
The first path is simple: reduce the perceived risk and close the knowledge gap around the asset.
Atlas has approximately four years between today and first production, currently targeted around 2030. These are four years during which the company can progressively de-risk itself by climbing the Lassonde curve, as hundreds of companies have done before: permits, binding contracts, financing, early works, construction, and then ramp-up.
Some steps are unavoidable: remaining permits, financing, early works, construction, and commissioning. Without them, there is no mine. Others are not strictly necessary, but would change the speed of the re-rating: a binding offtake, vendor financing, strategic equity, government support. Then there are the catalysts Atlas does not control: tariffs, a supply disruption, or a winter harsh enough to remind buyers that road salt only looks boring when the supply chain works.
Start with the gates Atlas has to clear.
The Critical Gates
These are the gates Atlas has to pass before Great Atlantic becomes a mine. Calling them “catalysts” almost understates the point. If one of them never happens, the thesis breaks. The question is timing, cost, and our sempiternal friend, dilution.
Construction-financing package announcement (expected H2 2026 to H1 2027). Atlas has appointed Endeavour Financial as project finance advisor, and the current financing file already has several visible pieces: senior project debt, possible export credit-agency participation, Sandvik’s non-binding C$132 million equipment and services MOU, and whatever equity remains after the debt stack is set. A term sheet announcement could move Atlas closer to the low end of the funded-developer range, around 0.2x to 0.3x of P/NPV.106 Atlas moving from 0.13x to 0.3x would represent approximately a 2-2.5x re-rate on the market cap alone, before any further catalyst is priced. Closing the financing package is bigger still, and in my comparable-developer framework could be worth another 0.1x turn of P/NPV in comparable cases. As a current shareholder of Atlas Salt, this is the event I am waiting for the most. And every shareholder should be too.
Binding offtake agreement with Scotwood or another major commercial partner (likely around the financing process, if it happens). At some point around the financing process, Atlas will need to turn commercial intent into something lenders can underwrite. That does not necessarily mean Scotwood at any price, nor an unconditional take-or-pay agreement four years before product exists. Buyers rarely accept that kind of delivery risk before financing, FID, construction, and final product specifications are locked. What lenders will want is commercial visibility: enough contracted or highly credible demand to support the first years of production, and enough confidence that Atlas can place its tonnes at the prices assumed in the financing case. Scotwood matters because it opens the packaged and retail channel, where the UFS gives Atlas essentially no specific credit. If the MOU converts on meaningful volume and acceptable pricing, the impact could be far larger than a simple confirmatory catalyst, it could change the NPV itself. So I would not treat Scotwood as being on the critical path. The base case survives without it. But a binding agreement with Scotwood, especially if expanded beyond the original 1.25-1.5 Mtpa framework, would reduce commercial uncertainty, help the financing discussion, and force the market to rethink the project’s economics. And if the market continues to ignore it, the cash flows will have the final say.
Construction decision / FID (expected H2 2027). The formal transition from “development” to “construction.” FID triggers the drawdown of vendor financing, starts the construction clock, and eliminates the “will they actually start construction?” question. Historically, the FID is worth 0.1-0.15x to the P/NPV uplift on its own, and it removes a categorical risk that was weighing on the P/NPV multiple. After FID, execution risk becomes the dominant risk. And more information should not take long to arrive.
Early decline performance (expected H2 2027 to H1 2028). After the main financing package, this is the most important milestone in my view: how fast the declines move, how wet the ground is and how much grouting Atlas needs before it can keep going? Atlas will do the work to mitigate the risk, but only building the mine will answer the questions. A clean first stretch would tell shareholders that the main decline risk is starting to clear. A messy one would not necessarily break the project, but it would bring back the two things every developer and shareholder wants to keep out of the conversation: time and dilution. As long as salt prices keep rising at 4% or more, and Atlas starts converting commercial intent into contracts that lock in volumes with higher-margin channels, I am willing to wait and accept further “bad” dilution. As we have seen, delays and additional financing needs are not the most value-destructive variables in the model.
First salt on surface (expected H2 2029 to early 2030). The first salt reaching surface is the moment the market knows the mine physically works. Production can still ramp slowly after this, but the binary “does it exist or not” risk is gone. The P/NPV multiple could move toward the construction-to-ramp-up range, about 0.6x to 0.8x if execution is clean.107
Commercial production (targeted 2030). This is the first moment where the story can be judged by shipments, customers, margins, and cash conversion. It also changes the shareholder base. Many institutions cannot or will not own pre-production developers, whatever the spreadsheet says. Once Atlas sells salt and begins building an operating record, that restriction starts to fade. The P/NPV could then move closer to 1.0x over the following 12-18 months as operational history accumulates.
These are the mechanical catalysts. Atlas simply has to execute. Not everything is within the company’s control, but that is precisely the point: how management responds to problems will reveal the quality of the team. Each one removes a reason to keep the stock in the “penalty box”.
The next bucket is different. Atlas does not need these variables to hit the base case, but they can compress the timeline if they land.
The Variables
I would treat these as second-order sources of re-rating. They just make the market more willing to believe the thesis once the main boxes are checked.
Additional offtake agreements beyond Scotwood. If Scotwood becomes binding on the currently disclosed terms, Atlas still has approximately 2.5-2.75 Mtpa of nameplate capacity left to place. That remaining volume is where the next layer of value could, and should, appear, ideally through emergency/spot sales or through additional retail/commercial distributors. I would not expect one big “aha” moment here. More likely, each contract removes a little uncertainty and gives the market one less excuse to value the project like an orphaned junior.
Strategic investor participation. The October 2025 LIFE financing included a “strategic investor,” but Atlas has not disclosed the name. If that investor, or someone in the same category, appears again in the construction equity tranche, the signal may matter more than the cheque itself. It tells the market that someone with a strategic reason to care has done some work on the asset and was still willing to put money in. In a junior developer, that can move the discount rate in people’s heads before it ever moves in the model. On its own, that could expand the P/NPV multiple by 0.05x to 0.1x, possibly more depending on the name. The market has seen this before. In exploration and development stories, a recognized backer can sometimes reframe the whole asset almost overnight. When someone like Michael Gentile discloses a position, it is not unusual to see a junior move 3x or 4x in a few weeks simply because the shareholder register suddenly gives the market permission to pay attention.
Analyst coverage. Atlas is no longer completely uncovered. Ventum initiated coverage in March 2026. Still, one analyst is not enough to create institutional ownership, but it is enough to give investors a model, a target price, and a broker who can put the name in front of accounts that were never going to start from zero. Coverage is still thin, but the awareness discount is no longer entirely untouched. Each additional piece of coverage after the financing package is announced increases the likelihood that deep-pocketed investors start paying attention to the setup.
TSX main-board uplisting from TSXV. Many institutions simply cannot own TSXV names, or cannot own them in size. An uplisting widens the buyer base. I would see it less as a catalyst and more as a later-stage “release valve”: once the project is de-risked enough, the exchange itself stops being part of the discount.
Indicated & Inferred Resource conversion. Atlas has 288 Mt of Indicated Resources and 868 Mt of Inferred Resources grading 95.2% NaCl. If even a modest portion is converted over time, the mine life could extend by several more decades. That would lift modeled NPV through duration rather than margin. The market will probably not pay much for it today, which is fair. The interesting point is that conversion should get easier once the mine is underground and Atlas has better geological information than surface drilling can give it. A useful reminder for the patient investor: Great Atlantic is a laterally continuous bedded salt deposit, and salt deposits tend to be relatively homogeneous. Some salt mines have operated for decades on the back of only a handful of initial drill holes. That does not make the Inferred Resource bankable today, but it does make the optionality more credible than it would be in a structurally complex gold or copper deposit, especially in an M&A scenario.
The External Catalysts
Atlas does not control these, but any one of them would compress the re-rate timeline.
A severe winter. Spot salt prices crossed C$300/t during the 2025-26 Ontario season. Road salt procurement is backward-looking in the way most municipal procurement is backward-looking: a spot price spike does not fully reset the next contract cycle, but part of it tends to bleed into the following year’s contracted prices. A repeat season would lift the North American road salt pricing environment and make Atlas’s operating leverage harder to ignore.
Disruptions to imported salt. A tariff, duty, trade dispute, or ocean-freight shock affecting Chilean, Egyptian, or Moroccan supply could tighten a market that is already structurally short. The current political environment around “buy North American” makes this more plausible than it would have been five years ago. Higher ocean freight would have a similar effect. It would not make imports disappear: even after adding Atlas’s planned 4 Mtpa to North American supply, the market would still need several million tonnes of imports every year. Most likely, the result would be higher delivered prices, mostly passed through to American end customers, whether the buyer is a DOT or a homeowner who still remembers slipping on their icy driveway last winter.
Disruption at an existing North American producer. Compass Minerals’ Goderich mine, with approximately 7.5 Mtpa of capacity, has faced labour issues and geological disruptions in recent years. A material shutdown there would leave existing demand with fewer local tonnes and make many procurement managers more willing to pay up, because nobody wants to be the one who ran short of salt when the roads froze.
None of these is required. The Lassonde framework already gives the direction of travel, but external shocks would shorten the distance between recognition and value.
Timing and Sequence
The visual below summarizes the sequence: what has to happen, what can accelerate recognition, and what could force the market to reprice the asset from the outside.
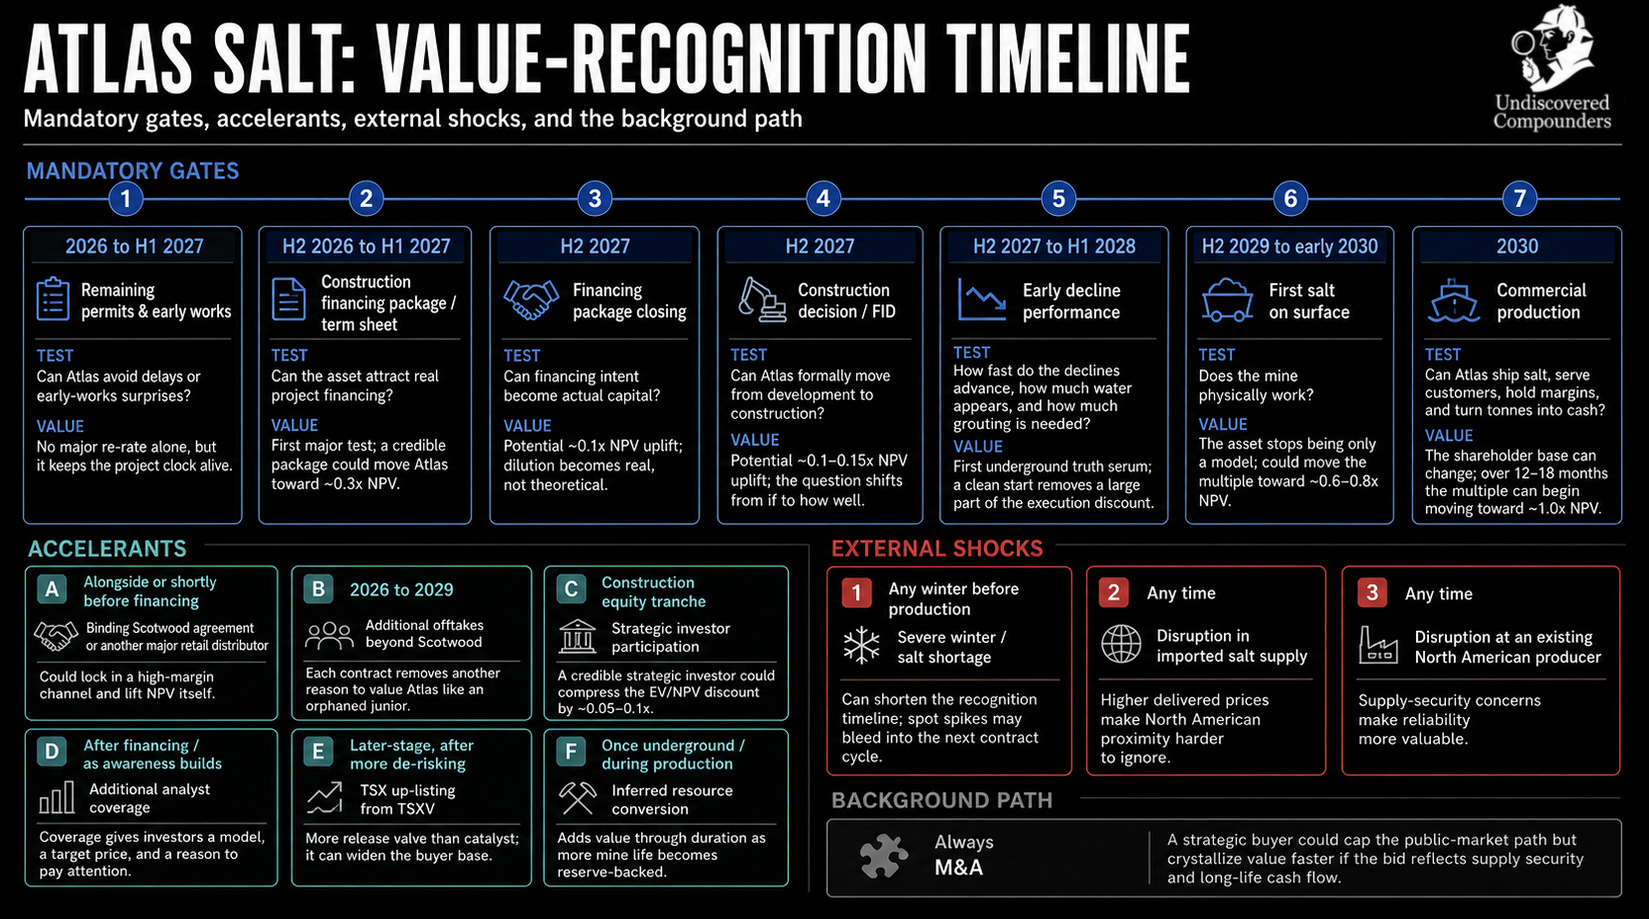
If Atlas re-rates, it will probably happen in steps, both up and down. The important point is that Atlas has more visible paths to positive recognition than to permanent impairment. The negative events, however, are more concentrated in the near term: financing terms, dilution, early-works execution, and the first underground questions.
That is why this setup only makes sense for patient capital. Over a one-year horizon, the risk/reward can be dominated by the timing of one bad event. The thesis can be right and the stock can still trade badly for a while.
But the re-rating is not strictly necessary. A truly patient shareholder can simply wait for the asset to turn into cash flow, then hold it for 24 years, potentially longer if additional resources convert.
Sit-on-your-Ass
At around C$1.20 per share, Atlas does not need to re-rate quickly for the investment to work. It could simply become a cash-flowing asset. A very patient shareholder can sit through the financing, the construction, the ramp-up, and the debt repayment window, then own their share of the mine when the cash starts coming back.
In my model, Atlas has effectively repaid its construction debt by the end of 2036. Add two years for “safety”. By 2039, the project would, under that model, still be generating around C$190 million of after-tax cash flow per year.
Now assume 100% dilution from today. With twice as many shares outstanding, and if that cash flow were fully paid out, that would be approximately C$0.80 per share in annual dividends.
On a C$1.20 purchase price, one year of dividends would return 67% of the initial investment.
Thirteen years later, yes. But at that point, the reserve-backed mine life would still have approximately fifteen years left, before assigning any value to the broader resource base.
The example is deliberately simplistic. It ignores capital allocation choices, tax timing, debt covenants, and whatever else reality decides to add. But it shows the shape of the setup. A truly patient shareholder can buy a share that could, years from now, start behaving almost like a bond with an absurd coupon on original cost.
The UFS implies nearly C$4.6 billion of cumulative after-tax cash flow over the reserve-backed mine life, before shareholder-level financing costs and before assigning any value to the 288 Mt of Indicated Resources beyond the reserve base or the 868 Mt of Inferred Resources sitting outside the mine plan. Against a market cap near C$120 million, I think we can call that an asymmetry.
Again, all the risks discussed throughout this deep dive still apply. But so do the unmodeled upsides.
The market wants recognition. I want it too. But recognition is not the only way to get paid. Waiting can work too.
In fact, there is a way not to wait that long.
Someone Else Pays
Someone else could buy the asset, and I think that outcome is fairly plausible.
Shareholders do not need it for the thesis to work. I am not even sure they should want it, unless the price is exceptional. But ignoring the strategic-buyer angle would be lazy.
Why M&A
Atlas is not worth the same amount to a minority public shareholder and to a potential strategic acquirer.
Atlas owns the scarce piece: a potential new Atlantic supply source in a market short of local tonnes. But in salt, the tonne is only half the asset. The route to the buyer is the other half: terminals, storage, contracts, trucks, retail accounts, procurement relationships, and… trust. That is where a large part of the margin lives.
Atlas has to build or borrow that system, but a strategic buyer may already own it.
That changes the math, literally. The public market discounts Atlas for the missing pieces around the mine. A buyer with those pieces already in place can discount less, probably much less. Its balance sheet and commercial infrastructure are operating assets in themselves.
This is why M&A, if it happens, probably starts quietly. More volume under offtake. A strategic cheque. A distribution agreement. Vendor financing with sharper terms. A partner that wants to get closer before the market understands why. If that sounds familiar, it should. Atlas already brought in an undisclosed strategic investor in the October 2025 financing. Management said that investor’s interest in Atlas and Great Atlantic aligns with its own long-term strategic objectives. I would not turn this into a takeover thesis, but I have read enough headlines like this to know it belongs in the distribution.
In North American salt, that would hardly be unprecedented. The sector has consolidated before. K+S sold its Americas salt business, including Morton Salt and Windsor Salt, to Stone Canyon Industries Holding, Mark Demetree and Affiliates for US$3.2 billion at about 12.5x EBITDA.108 Operating salt assets with customers, logistics, and cash flow have attracted real strategic capital. Great Atlantic is not there yet. But that is exactly the point: the closer Atlas gets, the more it starts looking like something the industry already knows how to buy.
When M&A
The law is the same for shareholders and acquirers: the more Atlas de-risks, the more expensive it “should” become.
Before project financing, the buyer would be taking the whole problem: financing, construction, and execution. That can happen, but only for a buyer strategic enough to want control of the asset before anyone else, and willing to carry the risk to get it.
Once a credible financing package exists, the door opens to more buyers. After FID and the first decline work, the negotiation changes again. A mining operator can then look at the asset and say: we know how to build this. At that point, every meter of decline that behaves as expected should reduce the discount a buyer can demand.
After first salt, the asset becomes much easier to buy, but also much harder to steal.
That is where M&A becomes more interesting for shareholders. Before production, an acquirer is still asking to be paid for the risks shareholders chose to underwrite themselves. A bid at that stage can crystallize value early, but it can also take the trade away before shareholders have been paid for underwriting the hardest risks. The buyer gets to hide the upside behind “remaining uncertainty.” I am not interested in having my alpha buried inside someone else’s risk memo.
After first salt, the discussion changes. The mine exists, the salt reaches surface, and the remaining value is no longer just project risk collapsing. From there, an acquisition is priced more around the buyer: its operating platform, synergies, and the usual industrial logic. The risk discount has shrunk. The buyer can still argue, because buyers always argue, but it becomes much easier to make the buyer pay for part of the synergies.
In short, timing changes valuation. That is why I do not think an acquisition before production would be the best outcome for Atlas shareholders. My job is to take risk and get paid for it. I do not want another company taking the setup too early, then paying me with a discount dressed up as prudence.
But my opinion will barely matter. Management’s will.
Management’s Take
Talking about “management” as one block would be misleading.
Start with Peterson. His line on M&A was clear enough: “We’re focused on building this thing and then discussions [about M&A] will emerge from that. I have no doubt.” That is the right posture: build the mine, make the project work without a buyer, then, if a buyer comes, negotiate from strength.
Nothing revolutionary. He does not close the door, and he does not open it wide enough to invite a lowball. But the M&A angle is clearly in his head. After hearing that answer, I would assign a higher probability to an eventual strategic discussion than I did before.
If that moment comes, Peterson will be the person responsible for extracting value from the buyer. That’ll be his job.
Then there is the elephant in the room: Vulcan Minerals.
Vulcan remains the anchor shareholder, and its CEO, Patrick Laracy, remains the gravity in the room. Through Vulcan, his personal stake, the board history, and the royalty, he is tied to Atlas in more than one way. Most of the time, that is alignment. A higher Atlas share price benefits him directly. A higher takeout price benefits him directly. A financing done later and at a higher price benefits him directly.
Good. But there is always a “but.”
Vulcan also has the 3% Net Production Royalty to protect in a change-of-control negotiation. A buyer may care about buying out the royalty almost as much as buying the equity. Or it may accept the royalty and reduce the premium. Either way, the deal is not only about Atlas shareholders selling their shares.
This is the one place where Vulcan’s alignment can become less clean. Vulcan wants a high Atlas share price, but it also wants to preserve or maximize the value of the royalty. Those two objectives should usually point in the same direction, but they do not have to. A structure that maximizes Vulcan’s total value through the royalty may not be exactly the same structure that maximizes value for minority shareholders through the equity.
I do not think this is the most likely problem. Atlas shareholders would still have a say in most change-of-control structures, whether through a vote or a tender decision. The board is not only Vulcan. Peterson, Howe, and Kelly matter. And the royalty is already inside the UFS economics, so this is not a hidden bomb under the NPV.
Either way, the negotiation is not as simple as “what is Atlas worth?”
Call it the cost of having the people who found the asset still sitting around the table.
Signals to Watch
First, the obvious: rumors are cheap. In a market this obscure, they are usually worse than cheap. They create the illusion of information.
The first signal to watch is the undisclosed strategic investor. That box is already partly checked. If that investor increases its position, or if other actors in the same category appear, the probability of a future strategic transaction goes up.
The second signal is contract architecture.
Every serious contract Atlas signs, and every MOU it converts, changes the M&A map. A binding Scotwood agreement would validate retail demand, but it would also give Scotwood a stronger reason to move closer to the asset, while making the project less clean for a buyer that wants full control of the retail channel. The same logic applies to port access, logistics, vendor financing, prepayments, strategic equity, and offtake.
In M&A, the first bid often starts as something more boring: volume, capital, logistics, or a right buried in the paperwork.
And yes, there are already early signals. The strategic investor. The non-binding MOUs announced years before production. The fact that several counterparties are willing to spend time and credibility around a mine that will not produce before 2030. Atlas is the kind of asset that should interest a lot of people in the sector. But these are only necessary conditions for M&A, not sufficient ones.
I could keep speculating, but the only point that matters is simpler: M&A is neither necessary nor sufficient for Atlas shareholders to make money. It is just another path. Potentially a very good one, depending on timing, price, and who gets to keep the synergies. But the thesis does not need it.
12. My Final Take
Most investors will analyze Atlas Salt through the UFS and the assumptions embedded in it.
They should. That is the official file. That is where the reserve base, the CapEx, the operating cost, the mine plan, and the C$920M after-tax NPV live. But the UFS answers a lender’s question: can this project be built and repay capital under defensible assumptions?
I am an investor, so my question is different: across the most probable range of outcomes, from very good to very bad, what is the present value of my share?
Answering that question forced me to challenge several assumptions inside the UFS, and that is where I found the hidden value. SLR’s conservatism is my opportunity. The salt price used in the UFS is far below recent market evidence. The assumed product mix looks conservative as well, which means the margin assumption is probably conservative too.
Those two variables influence almost every cash flow the mine will generate, from the first year of production to the last. They are far more consequential than a delay, a CapEx overrun, or the final financing structure, yet they are buried inside hundreds of pages of technical work, treated almost like anecdotal assumptions.
There is value to extract, and Atlas has people who know how to extract it, with every incentive to do so.
Construction risk is also limited compared with most peers, and this is starting to show in the financing file. The theory is not yet the practice. But the fact that Atlas is targeting 60% senior debt, while already having announced a non-binding financing MOU with Sandvik, is a large clue.
Put differently, I think the current valuation is pricing in a level of risk that is materially overstated.109
I have seen this kind of alpha before in micro caps, buried under the unknown and inside the assumptions of an official study. Rarely at this scale. It helps that Atlas operates in a sector unknown to 95% of investors and ignored by most of the remaining 5%.
I am a shareholder, and I intend to remain one. I am willing to hold through the full mine life, unless the market offers me an absurd valuation before then. Of course, I will update my thesis with every new piece of information, and I will sell if the assumptions that brought me here prove wrong.
I will keep sharing my analysis of Atlas Salt on Substack for as long as I remain a shareholder.
13. A Better Way to Play the Setup
Being a shareholder of Atlas Salt is only one way for me to play this opportunity.
There is another way to play the same underlying situation, with objectively more upside, objectively less risk, but a risk profile that is… different.
I know that may sound bold. But I have the math on my side.
This is literally an opportunity inside an opportunity, and I am pretty sure very few investors have found it. Fewer, in any case, than those who have found Atlas Salt.
The full thesis is here, and it will only be available to paid subscribers. From now on, I will publish most of my investment thesis behind the paywall.
This Atlas Salt deep dive was a preview, meant to give you an idea of the quality of the work you get with a paid subscription.
The introduction is free to read, and it might help you decide whether the full piece is for you.
$40M market cap vs. $120M in assets (and that's being conservative).

I found a way to get exposure to the Atlas Salt opportunity with a better risk/reward ratio.
If you have any questions or comments, the comment section and my DMs are open.
Take care,
Flo
Undiscovered Compounders
Disclaimer: I am not a financial advisor, and nothing in this article is financial, legal, tax, or investment advice. Nothing here should be understood as a recommendation to buy, sell, or hold any security. This research reflects my personal views at the time of publication and may change at any time, without notice. I may hold, buy, or sell securities mentioned in this article. You should always do your own work before making any investment decision.
Your money, your judgment, your risks, your returns.
Mining equity research usually frames this as P/NAV. I use P/NPV here because Atlas is effectively a single-asset developer: its NAV is very close to the C$920M after-tax project NPV calculated in the UFS, and using P/NPV keeps the analysis focused on Great Atlantic Salt, the salt mine that drives almost all of the company’s value.
Your snow-clearing contractor might be calling it quits amid worsening road salt shortage in Ontario, Our Windsor, 2026.
Ontario facing road salt shortage for second year in a row, Cottage Life, 2026.
Salt Market Size, Share, Growth & Report 2034, Fortune Business Insights, 2026.
Atlas Salt Targets 10% of North America’s 30M Ton Deicing Salt Market With Newfoundland Project, Crux Investor.
In 2019, 87% of U.S. salt exports went to Canada (USGS, Minerals Yearbook 2019).
Canada has been the largest single source of U.S. salt imports for decades, accounting for 29% in 2020-23 (USGS, Mineral Commodity Summaries 2025).
For simplicity, I use “DOT” throughout this deep dive as shorthand for public transportation agencies: U.S. state Departments of Transportation, Canadian provincial transportation agencies, counties, municipalities, and other public buyers responsible for winter road maintenance.
The four products serve very different markets outside deicing: chlor-alkali chemistry for brine, food and pharma for vacuum pan, table salt and industrial uses for solar, livestock and water treatment for rock. None of that matters here: Atlas sells into the deicing market, and the deicing market is the only one this analysis tracks.
The United States produces only a small amount of solar salt, but this production is almost entirely from Utah and is shipped along the West Coast. It is therefore not relevant to our analysis, which focuses on the East Coast.
USGS, Minerals Yearbook 2019.
The eutectic concentration is the specific mix of two substances that freezes at the lowest possible temperature. For salt and water, that’s 23% NaCl, which freezes at -21°C. Any other ratio freezes higher.
Caltrans, Brine Application Equipment and Methodology, Preliminary Investigation, January 2019.
PennDOT LTAP, Technical Information Sheet #129: Pre-Wetting Salt, 2006.
Port Jefferson winter maintenance guide cites sodium or potassium acetate at about 8x rock salt and CMA at about 5x. The Transportation Research Board / National Research Council’s FHWA-sponsored report states that CMA’s price was “more than 20 times that of salt”.
Minnesota Pollution Control Agency, Smart Salting for Roads Manual.
Mineral Commodity Summaries 2024 - Salt - USGS.gov.
Fortin Consulting, The Real Cost of Road Salt Use for Winter Maintenance in the Twin Cities Metropolitan Area, Minnesota Pollution Control Agency, September 2014, Table 1.
Band widths vary significantly by jurisdiction, here are some examples.
New York DOT uses the widest at 70-150%, with a 10% contractual surcharge above 120% and 15% above 130%.
Michigan’s MiDEAL cooperative program goes a step further, requiring awarded vendors to hold 30% of contracted volume as physical reserve stock within state borders.
Pennsylvania’s COSTARS contract (which pools PennDOT, state agencies and participating municipalities) priced at a statewide weighted average of $84.41/ton for the 2024-2025 season, up from $80.10/ton the year before.
Source: Clear Roads research report CR14-10; PA DGS COSTARS 2024-25 contract filing.
PennDOT / COSTARS, 2025–2026 Sodium Chloride (Road Salt) Season Contract, 2025.
SIMA, Snow & Ice Management Standard Glossary of Terms, December 2017.
Iowa Department of Transportation, Winter Maintenance Program: Winter Maintenance Overview, 2008.
Legal claims filed when someone slips and falls on an unsafe surface, typically an icy parking lot or walkway, and sues the property owner for negligence.
USGS, Mineral Commodity Summaries, 2024.
USGS, Mineral Commodity Summaries, 2024.
SLR Consulting (Canada) Ltd., NI 43-101 Technical Report, Great Atlantic Salt Project, 5 November 2025.
During the winter 2024-2025, Erie County (New York) paid approximately $120 per tonne in emergency purchases against a contracted price of $43, a 2.8x multiple. 29 counties were affected statewide.
Source: New York Public News Network, August 18, 2025.
Crux Investor, Salt Report, 2026.
Atlas Salt’s CEO mentioned a trucking radius of around 150 km for the economics to remain viable, but I haven’t found a clear source.
Portland Press Herald, 24 February 2026.
WILX Lansing, 2 February 2026, Haslett Landscaping.
USGS, 2019 Minerals Yearbook, Salt.
Crux Investor, “Salt Market Insight with Atlas Salt,” February 2026.
Not an operating cost, but a producer-level selling price.
USGS, Mineral Commodity Summaries 2024.
One important factor that often determined the quantity of salt that could be imported was the depth of channels and ports; many ports were not deep enough to accommodate larger ships.
USGS, 2019 Minerals Yearbook, Salt.
Compass Minerals, Compass Minerals Announces Labor Strike at Goderich, Ontario, Salt Mine, April 27, 2018.
Landscape Trades, Continent-Wide Salt Shortage Expected, October 2018.
Nolan Peterson, CEO of Atlas Salt, PDAC 2026 conference (via Proactive Investors, March 2026).
Nolan Peterson via Crux Investor, February 2026.
Mining economics tend to deteriorate over time. Mines extract the most accessible/lowest-cost zones first. As operations age, working faces move further from the main shaft, haulage distances increase, and ventilation and water management become far more complex. The toothpaste tube is a fair analogy: the first squeeze is easy, the last one takes effort. In practice, this means that the existing North American supply base is gradually becoming more expensive to operate.
2025 New York Laws STF - State Finance Article 11 - State Purchasing 162-A - The New York State Buy American Salt Act.
Cargill’s two remaining U.S. salt mines, Cayuga (under Lake Cayuga, New York) and Whiskey Island (under Lake Erie, Cleveland), sit under major water bodies and carry environmental liability few buyers will underwrite. If no buyer emerges, closure becomes one of the most rational exits, as happened with Avery Island in 2021.
Standard-Examiner, “Compass Minerals to abandon lithium extraction on Great Salt Lake”, February 8, 2024.
FDA Class II recall classification, December 13, 2024.
K+S Americas / Morton Salt: $3.2B in 2021; Kissner Group: $2.0B in 2020.
Nearly all Mexican salt exports come from Exportadora de Sal at Guerrero Negro (Baja California Sur), serving Pacific basin markets.
Source: Geo-Mexico.
USGS, Mineral Commodity Summaries, 2026.
USGS, 2019 Minerals Yearbook, Salt, Foreign Trade section.
The regime is legally contested, so I would not underwrite it. But the uncertainty itself still favors local salt, at least under this U.S. administration.
USMCA is up for joint review in July 2026, and both Trump and Carney have indicated they want to renegotiate parts of it.
U.S. Geological Survey, Minerals Yearbook 2019: Salt, October 2022.
Compass Minerals International, Inc., Form 10-K for the Fiscal Year Ended September 30, 2025.
New York State Senate Bill S.9441/A.7919-A.
Compass Minerals International, Inc., Goderich Mine 2021 Technical Report Summary, September 2021.
Atlas Salt, Investor Presentation 2026.
GLISA / University of Michigan, “Precipitation, Climate Trends in the Great Lakes Region”.
Yang and Hu, analysis of NOAA Storm Events Database (1996-2025).
Chenxi Hu, postdoctoral researcher, quoted in Science (AAAS), February 3, 2026.
Minnesota DOT / ClearRoads, “Development of a Handbook of Best Management Practices for Road Salt,” CR14-10.
Salt has been the dominant deicer for centuries, but that does not make it a permanent truth. Still, any viable disruption of this sector, if it came, would take years or decades to materialize because of regulation, logistics, and infrastructure.
Feasibility Study, Atlas Salt, 2023.
Compass Minerals, Goderich Mine, Technical Report Summary, amended December 14, 2022.
Compass Minerals’ Goderich mine, the largest underground salt mine in the world, producing approximately 7.25 Mtpa, compiled its current reserve base from ten core boreholes drilled in the 1950s, supplemented by 65 years of mining experience. Cargill’s Whiskey Island mine in Cleveland expanded its mined footprint from 4 square miles in 2013 to 16 square miles in 2023, working the same Salina Group salt bed without proportional new drilling.
Handysize and Handymax are mid-size dry bulk carrier classes, ranging from approximately 10,000 to 60,000 deadweight tonnes (DWT). Smaller than Panamax or Capesize vessels; they trade off cargo volume for port flexibility, they can call at regional ports that larger ships physically can’t enter. The match is deliberate: Atlas is not shipping to deep-water mega-terminals, it is reloading East Coast ports designed for exactly this size class.
To be more precise, the St. Lawrence Seaway (the only marine route from the Great Lakes to the Atlantic seaboard) closes every winter. Locks shut around December 24 and reopen in late March (even later in early-freeze or heavy-ice years). During that window, Great Lakes producers like Goderich must fall back on rail and truck to reach Mid-Atlantic markets, a slower and far more expensive option than bulk shipping.
Atlas Salt company messaging as reported in Crux Investor, February 2026.
Canadian Coast Guard, Icebreaking Service Fees.
Canadian Coast Guard, Icebreaking Service Fees.
Discounts of up to 35% are available for vessels holding a recognized ice-class certification. At this stage, no specific information has been provided, and this is likely to remain the case throughout most of the mine’s construction phase.
Atlas plans 4.0 Mtpa of production shipped through Handysize to Handymax carriers (10,000-60,000 DWT per UFS). At an average loaded tonnage of 50,000 T, this implies 80 vessel transits per year; at 40,000 T, 100 transits. The Gulf ice season runs 116 days = 31.8% of the calendar year. Road salt shipments concentrate in the second half of the year ahead of the winter contract delivery window, so the share of transits falling inside the ice season is plausibly higher than the calendar fraction, I assume 30% to 60% as a working range. Depending on how CCG bills in-and-out port calls (per entry or per billable event), the annual icebreaking bill works out to C$90,000-$400,000, or approximately $0.02-$0.10/T shipped. These are back-of-the-envelope estimates, but they show that the cost is almost certainly trivial.
There is a secondary risk, modest in impact. The Coast Guard allocates icebreaker escorts by priority: ferries under Terms of Union, dangerous goods, and community resupply all come before a bulk salt carrier. In an exceptionally bad winter with several operators queued at once, Atlas waits its turn: a matter of hours, or possibly a day.
In the first nine months of 2025, gypsum proceeds totaled just C$67,148, and the company disclosed no mining activity in 2024 due to contractor unavailability.
Source: Atlas Salt MD&A Q3 2025.
Another regulatory requirement worth flagging: mine closure. Before Atlas can even start Early Works, the Mining Act, 1999 requires the company to post financial assurance, money locked away today to guarantee the site will be properly rehabilitated when the mine shuts down. For Early Works, that amount is set at C$2.71 million. For the full mine life, total closure costs are estimated at approximately C$14 million, covering the hydraulic sealing of the portals (to prevent groundwater or animals from entering), the flooding of the underground void, re-vegetation of surface stockpiles with an endemic seed mix, and restoration of the surface to its pre-mining topography. The port at Turf Point is owned by a third party and is not Atlas’s responsibility to close.
Qalipu Mi’kmaq First Nation: Newfoundland’s largest Indigenous group (24,000 members), federally recognized in 2011. Based in Corner Brook, about 70 km north of the project.
Management has left open the possibility of limited pre-production salt sales into the local Newfoundland market before 2030, but gives no volume, timing, or economics. I mention it in a footnote for the sake of rigor, but I do not factor it into my analysis.
ASTM D632-12 is the American Society for Testing and Materials standard for sodium chloride sold as road deicing salt. Required specifications: minimum 95% NaCl purity; maximum 2% moisture; gradation from 0 to over 12.5 mm; 0% to 15% fines passing the 0.5 mm (#30 mesh) screen; Yellow Prussiate of Soda anti-caking treatment at 50 to 150 ppm. Source: UFS Table 19-1.
Screened Mediums is a commercial specification used by distributors supplying private contractors, condominium associations, and commercial property managers. Required specifications: minimum 95% NaCl purity; maximum 0.5% to 1% moisture; gradation from 2 mm to 6 mm; less than 5% fines passing 2 mm; Yellow Prussiate of Soda at 50 to 150 ppm. Source: UFS Table 19-1.
The UFS explicitly excludes any other monetizable salt type. This is a deliberate strategic choice: chemical, food, and industrial salt grades require additional processing steps that the current flowsheet is not designed to deliver. Management has on several occasions mentioned the possibility of entering these higher-margin segments later, once the mine is operational and running at steady state. For now, it is not material to the investment case.
The estimated C$60-C$80 range is derived as follows. A 20 kg bag of rock salt (Windsor Safe-T-Salt, pure NaCl, the closest comparable to Atlas’s planned product) retails between C$9.60 and C$10.80 across Canadian retailers, or approximately C$480-540 per tonne at shelf. Retailer margin on hardline commodities at Home Depot and Walmart typically runs 25-30% (Home Depot FY2024 10-K: consolidated gross margin 33.4%; deicing salt as a low-margin seasonal commodity sits below that average in my opinion). The JV therefore receives approximately C$335-405 per tonne from the retailer. The JV’s costs include:
The bulk salt purchased from Atlas at approximately C$82/t, which is Atlas’s FOB Turf Point price and its rational floor;
Packaging costs (bags, bagging line, palletization) estimated at C$75-95/t based on industry benchmarks for commodity salt;
Distribution to retail distribution centers and/or retail locations estimated at C$40-60/t.
Total JV costs: approximately C$200-235/t.
Residual JV profit: approximately C$100-205/t, split 50/50 per the MOU terms (“share profits equally after reasonable recovery of costs”, Atlas Salt press release, August 20, 2024). Atlas’s 50% share: C$50-120/t mechanically, with C$60-80/t as my central underwriting range. This is incremental to the C$82/t the UFS already models for every tonne, since the transfer price to the JV will probably approach the FOB price the NPV already assumes. Compass Minerals FY2024-FY2025 earnings releases corroborate the order of magnitude: its Consumer & Industrial segment averages USD $195-204/short ton versus USD $71.5-73/short ton for Highway Deicing. A producer-level spread of approximately CAD $175-200/tonne for a fully integrated operator capturing the entire chain. Atlas, splitting with Scotwood, captures approximately half that spread, consistent with the C$60-80/t range.
MB670-1 continuous miners, MT521 roadheaders, TH550B 50-tonne battery-electric haul trucks, LH518iB 18-tonne battery-electric loaders, and DS412iE battery-powered bolters.
Atlas Salt Inc., Management & Directors: Rowland Howe.
Protection Committee, Rowland Howe.
World Copper Ltd., World Copper Announces Appointment of New Chief Executive Officer, April 26, 2021.
Preliminary Economic Assessment, the earliest and least certain level of economic study in mining, two full steps below the feasibility study Atlas already has in hand.
A conversation with Nolan Peterson, CEO of Atlas Salt, YouTube.
Nouveau Monde Graphite Inc., NMG Secures Senior Project Debt for Phase-2 Matawinie Mine, March 17, 2026.
Canada Nickel Company Inc., Canada Nickel Announces Receipt of Letter of Interest for up to US$500 Million from Export Development Canada, September 6, 2024.
Torngat Metals Ltd., Torngat Metals Secures $165 Million in Financing from Export Development Canada and Canada Infrastructure Bank, June 17, 2025.
Defense Metals Corp., Defense Metals Receives Letter of Interest for Potential US$250 Million in Project Financing, June 4, 2025.
Principal Asset Management, Private Infrastructure: 2025 Outlook.
I do not want to sound cynical, but public entities (the province, the federal government, development agencies) have strong incentives to finance this project. A mine that creates jobs and taxes with almost no direct GHG emissions, makes Great Atlantic a trophy project politicians can point to as a political success.
National Programme on Technology Enhanced Learning, Project Finance, Module 6.
Financial Edge Training, Loan Life Coverage Ratio, July 2021.
AFME, Project Finance Discussion Paper, November 2016.
World Bank PPP, Key Issues in Developing Project Financed Transactions.
McKinsey (2024) analyzed 80 global projects and found 83% experienced cost overruns, with underground mines averaging 55%. To put these figures into perspective: Bertisen & Davis (2008) reviewed 63 mining projects and found as-built capital costs averaged 14% above feasibility estimates, with approximately half falling outside the +-15% accuracy range. Export Development Canada (2016) studied 78 projects over US$50M and found an average overrun of 37%, with projects in the US$500M-$1B bracket averaging 25%.
Bulk road salt shipped and stored at scale is typically treated with an anti-caking agent before loading so it remains free-flowing through loading and ocean transport. Atlas’s UFS lists Yellow Prussiate of Soda at 50-150 ppm for typical government tenders and commercial Screened Mediums contracts. At that dosage, it is more a handling additive than a chemical-processing step.
The UFS summary and company materials present LOM sustaining capital at C$609.1M. I use that figure. There is one discrepancy in the technical report: Section 21.1.2 refers to C$627.5M, while the economic-analysis sections use C$609.1M and the company presentation rounds the same number to C$609M. I treat C$609.1M as the controlling figure, because it is the number that ties to the published economics.
Crux Investor, “Is Your Investment Lying About the Cost of Underground Mining?”, 2021.
P.R. Whincup, Guidelines for Mineral Process Plant Development Studies, 2010.
R.F. Rubio, Underground Mining Drainage, State of the Art, International Mine Water Association, 1998.
Calculation: a 30% overrun on the C$609M nominal sustaining curve equals C$183M of additional spending spread across 22 years of operations (Year 2 through Year 24). Each of those future dollars is worth less today because of the 8% discount rate baked into the NPV: a dollar spent in Year 10 is worth 46 cents today, Year 15 drops to 32 cents, Year 20 to 21 cents. Averaging across the full distribution gives a discount factor of approximately 0.42, which translates the C$183M of nominal overrun into about C$77M of pre-tax present value. Since sustaining CapEx is capitalized and then deducted against taxable income through depreciation, the after-tax impact comes in at approximately 70% of that, or C$54M. Against the C$920M after-tax NPV: 5.9%.
Camm & Stebbins (2023) Simplified Cost Models for Underground Mine Evaluation (Montana Tech Mining Engineering Handbook).
I assume labour at 40% of the C$15/t Mining line LOM-average, back-solved for Year 1 real cost (C$4.63/t) under SLR’s 2% escalation, then re-escalated at alternative rates over 25 years (Year 1-3 ramp + 22 years at 4.0 Mtpa = 95 Mt LOM). The 40% labour share is an industry benchmark, the UFS does not disclose the sub-line breakdown.
Probability weights: Bull (1.80%) 15%, Base (3.25%) 55%, Bear (4.5%) 30%.
January 2019 (3.833 c/kWh): NL Hydro, Schedule of Rates, Rules and Regulations, effective January 1, 2019.
July 2025 (6.179 c/kWh): NL Hydro, Schedule of Rates, Rules and Regulations, updated July 1, 2025, page IND-1.
The sensitivity of NPV to discount rate is driven by mine life. Every additional year of modeled cash flow is more heavily discounted than the previous one. A 10-year mine loses perhaps 15-20% of NPV moving from 8% to 10%; a 24-year mine loses 34%. This is structural to long-life projects and is one reason shorter-life mines can sometimes trade at higher NPV multiples than longer-life ones; the market implicitly discounts the long tail harder than the model does.
Alfonso Ovalle, “Analysis of the Discount Rate for Mining Projects,” MassMin 2020, University of Chile / Australian Centre for Geomechanics, 2020.
Gosson, Greg, and Graham Wood, Factors to Consider When Determining Appropriate Discount Rate for Project NPV, Canadian Institute of Mining, Metallurgy and Petroleum, March 2013.
The closest commercial port to Turf Point is the Port of Stephenville, historically known as Port Harmon, located approximately 10.6 km away as the crow flies. The port is an ice-free, deep-water facility on Newfoundland’s west coast and provides the nearest established cargo-handling infrastructure to the project area. It could represent a potential alternative, but using it would require a wholesale redesign of the project’s logistics and economics. I do not factor in this alternative, because if it became necessary, the project would no longer be interesting to me as a shareholder.
Atlas hired a market maker in November 2025 to improve trading liquidity. According to the CEO, the arrangement is month-to-month and will continue as long as the market maker keeps delivering liquidity, useful trading-flow analysis, and market intelligence.
Pierre Lassonde, The Gold Book: The Complete Investment Guide to Precious Metals, Penguin Books, 1990.
GenCap Mining Advisory / Dundee Precious Metals, Čoka Rakita Valuation Report, July 25, 2025.
Sprott Capital Partners, Upgrading precious prices on strong start to 2023, February 2, 2023.
Canaccord Genuity, Capricorn Metals Limited: Development decision rapidly approaching, February 28, 2018.
PwC, Mine 2017: Stop. Think... Act.
Canaccord Genuity, Capricorn Metals Limited: Development decision rapidly approaching, February 28, 2018.
This is a sensitivity-based valuation bridge. I do not have access to SLR’s full cash-flow model, so this is the most viable way to approximate the effect. The further the price case moves away from SLR’s published sensitivity range, the more approximate the math becomes. Still, it does the one thing I need here: show direction and magnitude.
There is one technical point. If I isolate “pure mix” at the UFS price curve, the impact is smaller: C$134.6M in the base case and C$307.8M in the bull case. The difference is the interaction between mix and the salt price curve. I include that interaction in the Sales Mix line because the valuation bridge has to add one block after the other.
Sprott Capital Partners, Upgrading precious prices on strong start to 2023, February 2, 2023.
Sprott Capital Partners, Upgrading precious prices on strong start to 2023, February 2, 2023.
K+S, K+S sells its Americas salt business to Stone Canyon Industries Holding, Mark Demetree and Affiliates, October 5, 2020.
That does not mean the risk does not exist. Even after mitigating every identifiable risk, a black swan can still reduce any investment to zero.
Never seen my iPhone 17 lag as when I opened this article haha. Hopefully there are as many Kilotons of salt in that mine as there are characters in this writeup 😩
You clearly did a tremendous amount of work. If I understood correctly (and I'm not a mining analyst so likely not), you noted 3 points.
1) After tax CF will be ~$150M to $200M after ramp up
2) Mines like trade below 1x NAV
3) NAV is ~$920M at 8% discount rate
My question is - Is it better to buy now instead of upon production commencement?
It seems like there are two buckets - pre and post operating - with very different risk reward structures. The first bucket sounds like taking construction risk and the second is the selling of salt which, as you detail quite robustly in your report, is a pretty steady business.
Again, tremendous work. Well done!