
7x earnings, 5th straight record year. Zero debt, 19% of the shares already gone. You're paid to wait.
Funny what turns up when you actually read the footnotes.

“Take a simple idea, and take it seriously.” - Charlie Munger
Build-A-Bear (BBW) took the idea of building your own stuffed animal, and took it very seriously.
Thirty years later, it’s one of the most recognized brands in America, a company with an exceptional run in the market (in the statistical sense of the word) and a valuation that looks nothing like its operating performance.
I’m not a shareholder yet, but I intend to be, under certain conditions. All of them spelled out, of course.
We’re in this together for the next 25,000 words, so let’s not waste time.
All unsourced company information comes from the company's recent official filings, available here. The reason is simple: neither of us wanted a deep dive with 400 footnotes.
Table of Contents
Table of Contents
The Short Thesis: Build-A-Bear’s Bull Case in Brief
Anatomy of the Bear: The Business Model
The Original Business Model, in One Gesture
The Products and the Average Basket
Beyond Make-Your-Own: Wholesale and Mini Beans
The Brands and Licensing
The Customers: From Kids to Kidults
The Doors: Stores, Formats and Franchises
The Unit Economics
Behind the Scenes: Supply Chain and Operations
Competition
The Macro Backdrop
The Context: Consumer Sentiment
The Behavior: How Consumers Actually Spend
Build-A-Bear’s History, Brick by Brick
A Study in Pink: The Founding and First Boom (1997-2007)
The Valley of Fear: Crisis, New CEO and Turnaround (2008-2019)
The Adventure of the Second Stain: Covid and the Record Run (2020-Today)
The Financials
The Income Statement
The Segments: Two Companies, One Multiple
The Balance Sheet and the Flows: The Capacity to Wait
Return on Capital (ROIC)
The Latest Quarter: Q1 2026 Results
The Quarter Itself
Analyzing the Walmart Partnership
The Crux: The Bear Case and the Four Risks
The Four Problems
Falling In-Store Traffic
Clickocalypse: AI Search and E-Commerce Traffic
Tariffs, Ô Tariffs: Supply Chain and Pricing Power
SG&A and Margins
The Overall Read: Weighing the Risks
Other Risks
Management and Capital Allocation
A New Dawn: The CEO Transition
The New Management
Capital Allocation
Incentives and Compensation
Insider Buying/Selling
Valuation: What Build-A-Bear Is Worth
Napkin: A Reverse-DCF First Pass
How Much, and Under What Conditions
The Variables
Growth by Segment
The Contribution Margins
The Rest of the Assumptions
So, How Much? IRR by Scenario
Sensitivities: What Moves the Return
The Free Upside: Optionality You Aren’t Paying For
Limiting the Cost of Waiting and Uncertainty
Limiting the Losses
Conclusion
I’m not a financial advisor and this isn’t financial advice. Your money, your judgment, your risks, your returns. The fine print here.
1. The Short Thesis: Build-A-Bear’s Bull Case in Brief
Starting point: the market prices Build-A-Bear (BBW.NYSE) at 7.3x earnings (price: $31, market cap: $392M).
At that level, you’re at least looking at a retailer at the bottom of its cycle, if not a company in real trouble, possibly both. So there are two questions to settle.
Is this really a cyclical bottom?
Is BBW really in trouble?
The first would take more arguments than a short thesis can carry, so let’s assume the worst-case answer just in case: yes, it’s a cyclical bottom, with all the trouble that comes with it.
Here’s how the company “copes” with that trough: BBW just booked its fifth record year in a row. $529.9M in revenue, $67.2M in pre-tax income, and EPS of $4.26, also a record. And it’s guiding for another record year on the top line.
A battered valuation that keeps printing record after record is always hiding something. In this case, almost certainly an opportunity.
The bet comes down to three things.
One: the weakness is cyclical. It may already be past its low, but it doesn’t even have to be. Michigan sentiment hit 44.8 in May and is already back to 49.5 in June. Build-A-Bear’s traffic has tanked far harder than most retailers’, with a real soft patch starting in 2026 (not for the obvious reasons, we’ll get to that, trust me). Weak, sure, but still a record year. The company guided for another record year, even after cutting guidance. I know, guidance isn’t a strong counterargument, but it was worth mentioning. Don’t worry, we’ll dig into the margins, the cash flows, and a few 10-K footnotes that say a lot more than any conf call.
Two: the engine of value creation has already changed in nature, and the stock probably hasn’t caught on. I know, it sounds like a cliché, but I’ve got the numbers to back it up. Commercial (wholesale plus licensing) is growing more than 20% a year (at high margin), some BBW products just landed in Walmart, and the company runs an international franchise that eats almost no capital. At 7% of revenue, commercial is still small, which is probably why it’s not in the price. Small, but it matters. Covering all of it will take some rummaging through the accounts and a few thousand words.
Three: the balance sheet pays you to wait. Zero debt, about $65M in operating cash flow, $40M in free cash flow, enough to buy back its own shares at 7.3x earnings (19% of its shares bought back over the last four years) and ride out a long trough while the fragile ones cut into their spending. Time is the enemy of bad businesses and the ally of great ones. BBW can wait a long time. A very long time.
Laid out like this, the asymmetry is almost embarrassingly simple. The eternal question: am I right, am I wrong, by how much, and at what odds. The eternal answer: here are my arguments and my numbers, judge for yourself.
2. Anatomy of the Bear: The Business Model
Let’s start with the bones.
2.1 The Original Business Model, in One Gesture
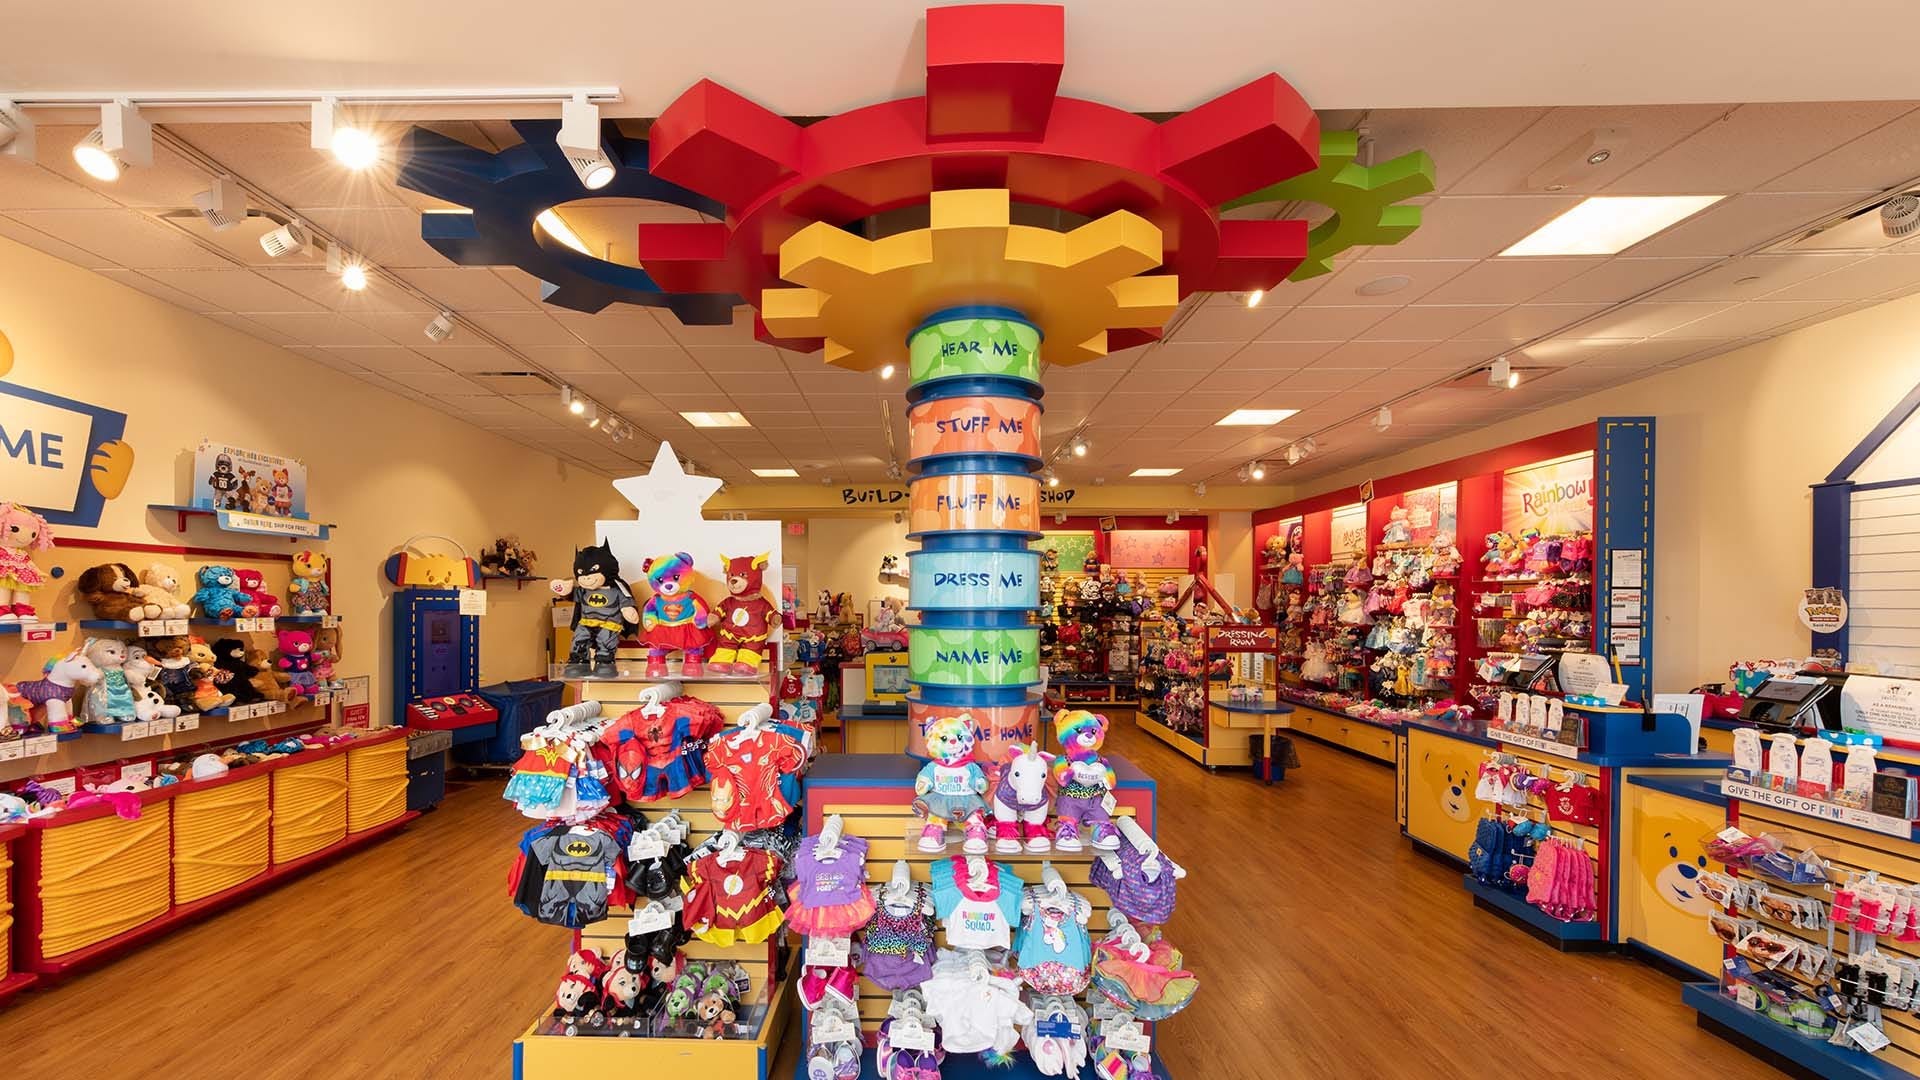
A kid walks in, scans the shelves, picks out a deflated plush shell, and hands it to an employee who fills it right there at the stuffing machine. Before it’s stitched shut, the kid slips a little fabric heart inside, one they’ve rubbed, kissed, and wished on. And there you have it, the “Heart Ceremony.”
They dress it, give it a voice and/or a scent, pick out shoes, name it, and walk out with a birth certificate in its name. That’s the founding gesture of Build-A-Bear. Hold onto it as the atom of this whole thesis: a brand that industrialized a moment of attachment, then spent thirty years spinning out every variation of it.
2.2 The Products and the Average Basket
That Heart Ceremony is psychologically devious. Through the ritual, the toy itself gets personified: the child has “birthed” the plush and given it a name. You instantly reach a level of attachment that goes well past anything bought off a shelf at Walmart. And a different kind of attachment means different behavior, financial behavior included.
A family walks in expecting to pay the sticker price on the plush: twenty-something dollars for a standard model, around ten for the entry-level one, more for a large format. Except the bare plush is only a starting point. Dressing it runs $5 to $15 more (more if the outfit comes from a license), giving it a voice or a sound, $6 to $15, a scent, about $5, and it can keep going for a while: shoes, glasses, a bag, and so on, let your imagination run wild.
All of it is easier to justify once the plush has a name. By the time you reach the register, the $25 bear is worth $60. The kid walks out in awe of their personified, personalized plush, the parents walk out in awe of the company’s commercial strategy. The “build-then-dress” model is a machine for turning a token of affection into extra lines on the receipt. The added cost of the ceremony itself is fairly minimal for the company: that work would have been done at the factory anyway.
On top of the core products sits a whole range of variations. At the high end, licensed or limited-edition plush. They go for $40 to $75, with some collector pieces north of $100.
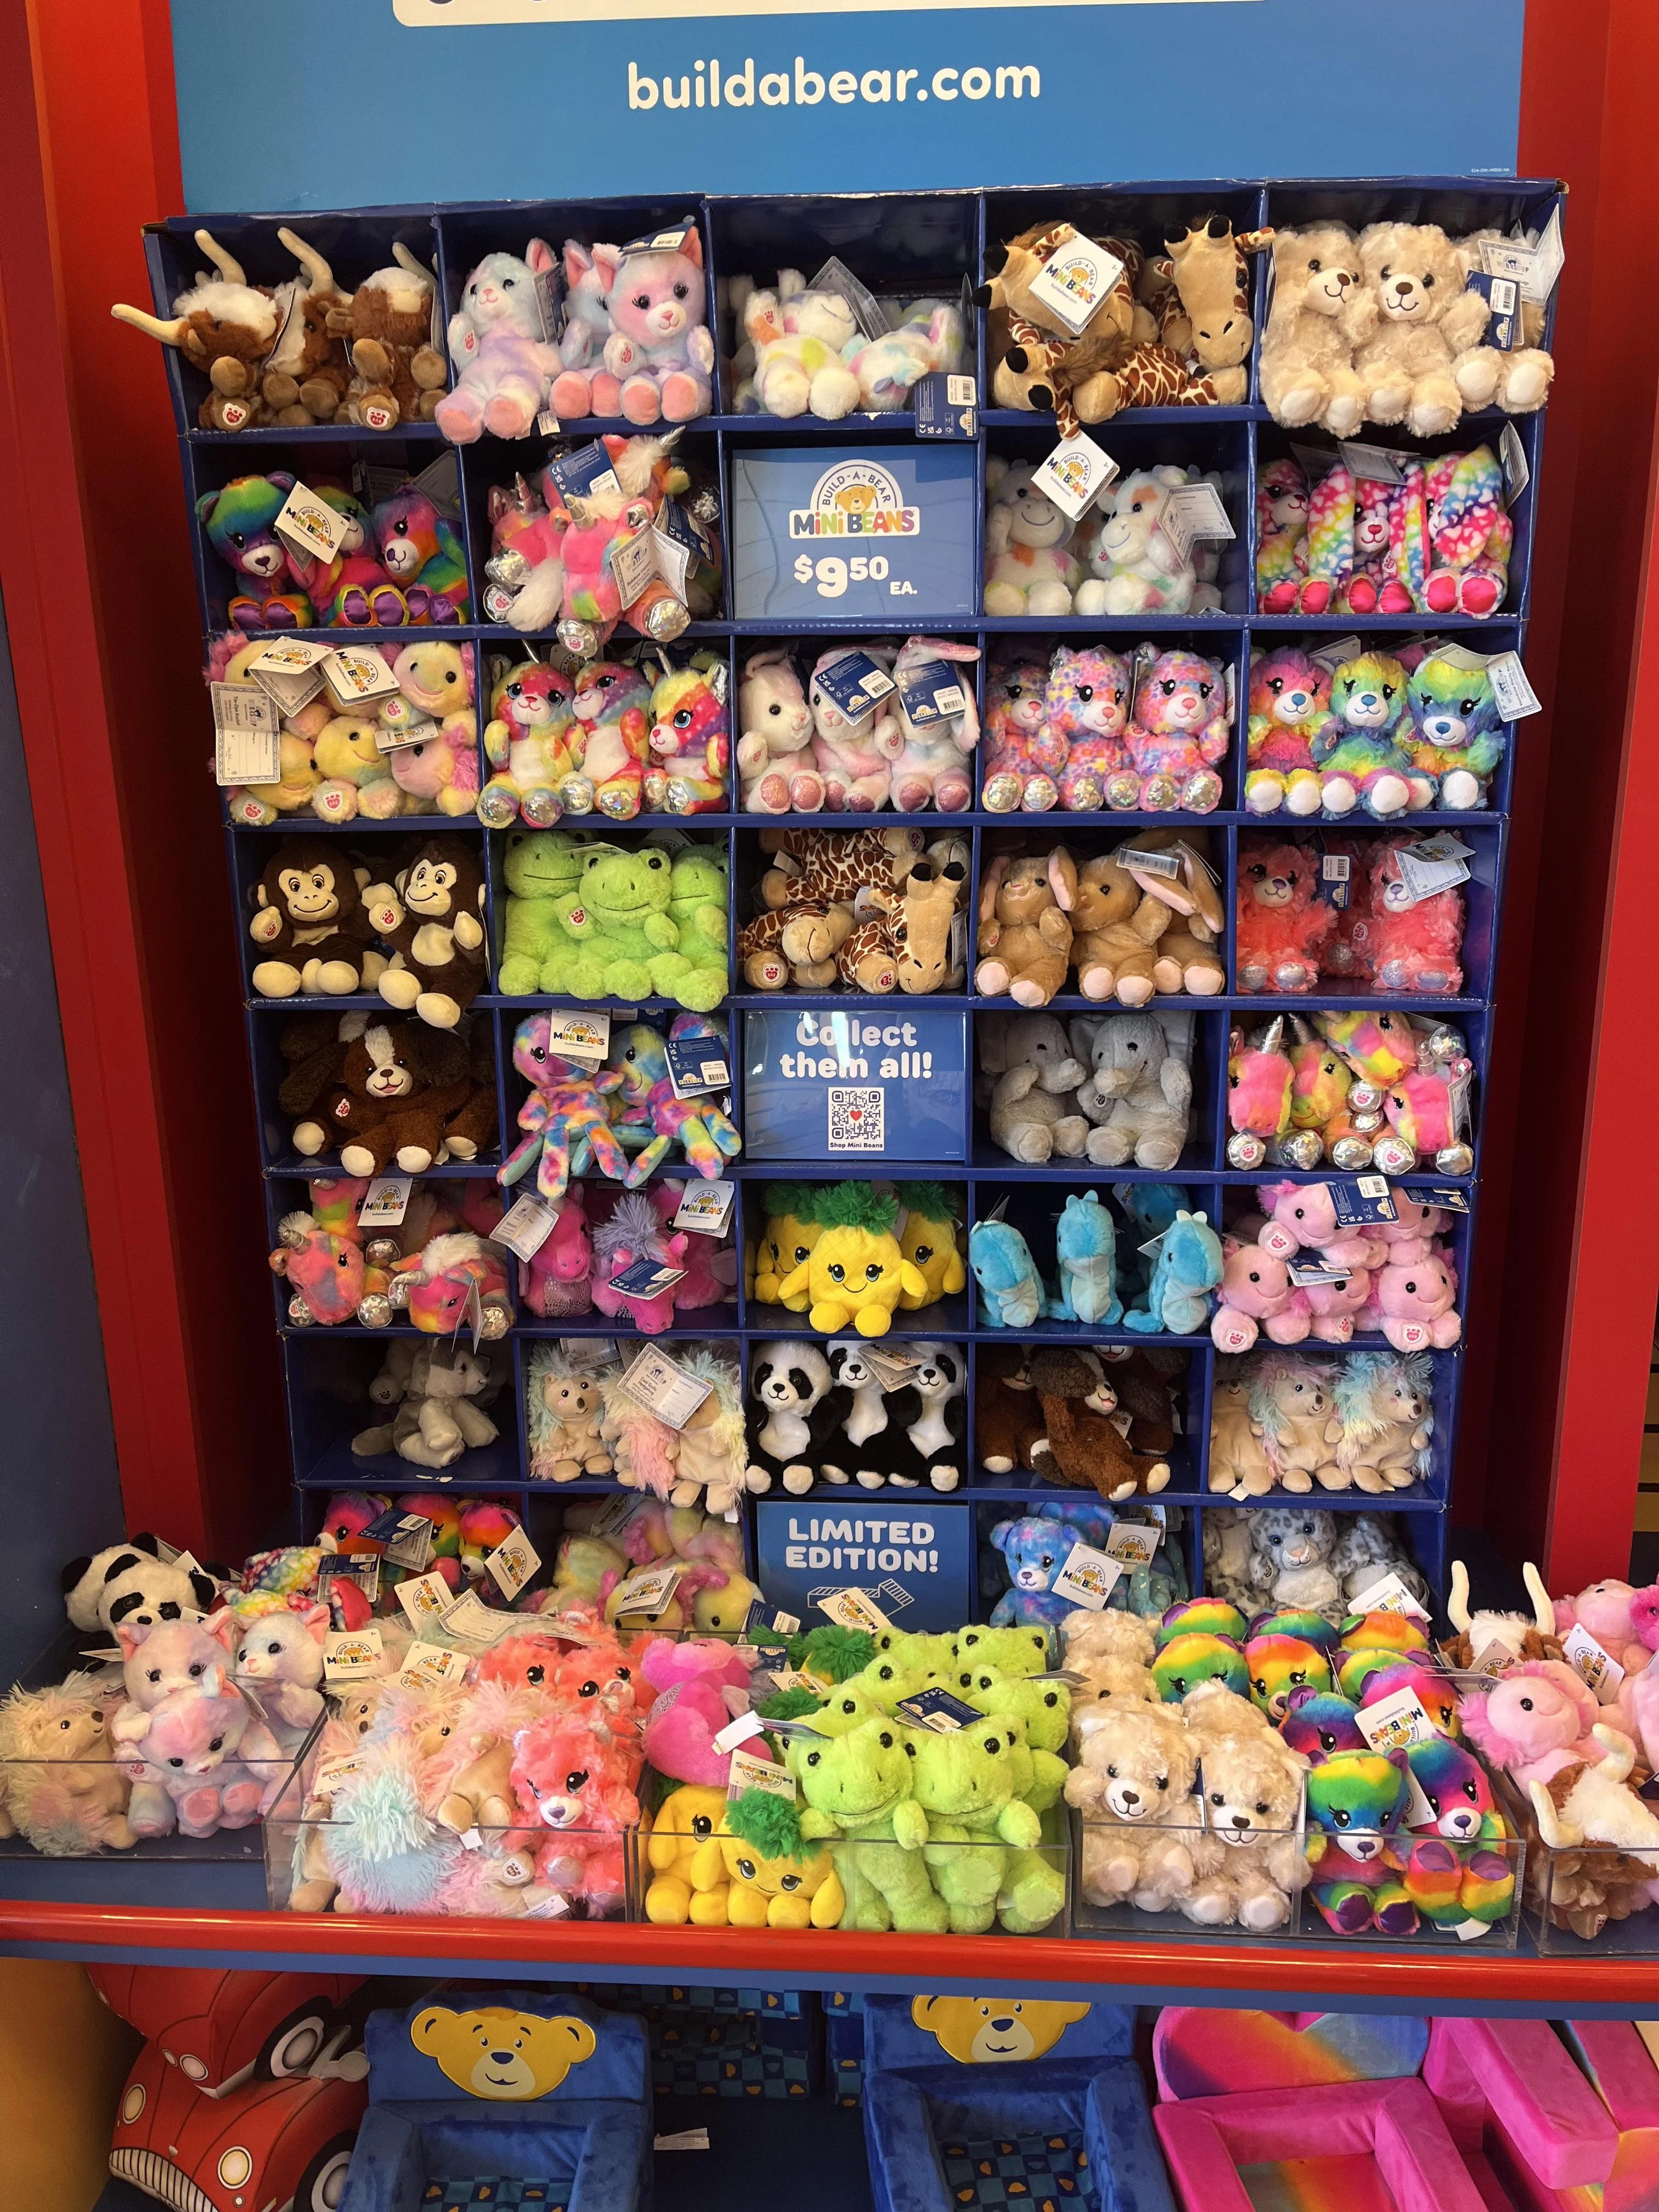
At the very bottom, the “Mini Beans,” small plush at around ten dollars, work as a loss leader and an affordable collectible (these are exactly the ones that recently showed up at Walmart). Between those two ends, the full range. The result shows up in a stat management likes to quote: average basket per transaction went from about $35 in 2012 to more than $53 in 2021, driven as much by the number of items as by unit price. The same visit now brings in half again what it did ten years ago.
Take all those plush types, multiply them out, add licenses, add dozens of different accessories, and you’ve described almost everything BBW sells.
Worth a special mention: the Bear Cave, a corner of the site for the over-18s, launched in 2019. Nothing NSFW, just licenses better suited to adults. The hardest thing I found is still pretty soft: a drunk bear (or at least one about to be), another crying blood, and a “you turn me on” t-shirt.
The ritual has also moved from the counter to the screen. You can build your bear online, on the “Bear-Builder.” It has to be a minor feature, because I tested it (purely for research, I promise), and “clunky” is being generous. It felt like a twenty-year-old Flash game running on Windows XP.
E-commerce has become, in the company’s own words, “its biggest store.” In practice it’s mostly a storefront that never closes, over-indexing on teens, adults, and collectors while the physical store stays focused on kids and families. To illustrate: when BBW added the option to record a voice message on the site, “Record Your Voice,” to drop straight into the plush, online sales grew double digits. Behind that double digit sits the chance to wish someone a happy birthday “directly,” do a gender reveal, send congratulations of any kind, and so on. To be fair, the digital bet was a bold one for a company that sells experiential, hands-on stuff, but it paid off (not without friction, as we’ll see later).
Once all of that is in place, the company “just” has to track sales in real time, push what works, prune what drags, while timing releases around the licensing and seasonal calendar (e.g., plush dressed in national colors for the soccer World Cup). That release cadence, synced to movie and event drops and orchestrated season after season, gives collectors and kids a reason to come back. Like a lot of retailers, the quality of the business model comes mostly from tightly managing its release strategy and its inventory.
This is the perfect moment to tell you a story that colors everything that follows in this deep dive.
2.3 Beyond Make-Your-Own: Wholesale and Mini Beans
Late 2023. The company is stacking records across all its segments and realizes the power of its brand has outgrown the make-your-own concept. Build-A-Bear is now Build-A-Bear. Might as well use the brand. So they create a line of plush that wouldn’t be self-assembled, stamped BBW, that the company could sell straight to retailers. The idea is to distribute plush, pre-made, in bulk, under the BBW brand (and the margins that come with it), on a regular basis.
That idea is what gives birth to the Mini Beans line in February 2024. Small pre-stuffed plush at $10, made to collect. The CEO lays out her strategy on a conf call:
“One of the reasons we launched Mini Beans was not just to put them in our stores, but as a proof point of the power of the brand to stretch beyond the make-your-own concept.” (Conf Call, Q2-24)
At first she sells them mostly in BBW’s own stores, but as the wins pile up, other retailers start taking interest within a few months:
“We are in the process of working with other retailers, not only here in the US but across the globe.” (Conf Call, Q2-24)
May 2025, the Mini Beans are available in other stores (Hudson, Applegreen, etc.). In the end, 2M units sold and a segment posting +30% YoY. The next quarter (Q2-25), Mini Beans climb to 80% YoY.
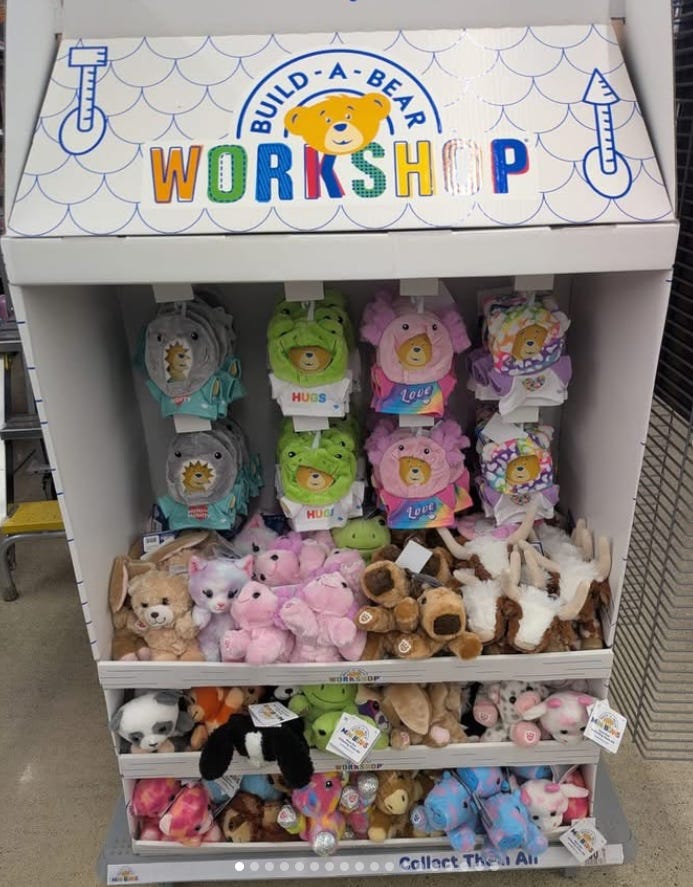
March 2026, management announces a partnership with Walmart to put Mini Beans in 1,500 of its stores. Naturally, it’s a collectible, so they roll out Walmart exclusives. The upshot: “a multimillion dollar wholesale order, now hitting shelves in approximately 1,500 Walmart locations across the U.S.” (Press Release, March 16, 2026)
What comes next, we don’t know yet. On the last conf call, the CEO pointed out there’d been no real feedback from Walmart yet. This Walmart partnership (and others with potential wholesalers) is one of the most important variables for the valuation. We’ll come back to it many times.
2.4 The Brands and Licensing
This is probably its least visible asset and, to me, its most powerful: a portfolio of more than 75 licenses (Pokémon, Star Wars, Toy Story, Harry Potter, NFL, Wicked, you name it). BBW has become, like LEGO, a meta-brand: a backdrop brand you can set almost any character on, and have the customer build it themselves if they want.
Each license brings its own audience, its own drops, and so its own reasons to come back. The downside is that it carries the main flaw of meta-brands: the loss of a key license. If Nintendo, Disney, or Sanrio suddenly stopped licensing their rights, the hit to BBW would be significant. In reality it remains win-win, and no major license has ever been pulled from BBW.
To limit that risk, BBW again did what Lego did: build its own brand. The Mini Beans are one example, all the more so since they also stack the meta-brand angle (a Hello Kitty Mini Bean, say). It owns other in-house IP like Promise Pets, Honey Girls, or Merry Mission, though none of it is as developed as the Mini Beans (and yes, we’ve seen crossovers like Promise Pets Mini Beans).
It has also tried its hand at other media. Since 2019, BBW has had its own studio, Build-A-Bear Entertainment, set up with Sony. So far the track record is thin:
Honey Girls, a musical feature released in 2021 on streaming/DVD, based on IP that’s been around since 2015
Glisten and the Merry Mission, an animated film released in November 2023, based on IP around since 2014.
Naturally, all of it got spun out across different media: radio, apps, video games, and so on (nothing worth mentioning). The box office stays modest, but profitability is beside the point here. The goal is to anchor the Build-A-Bear brand in the minds of kids and their parents. The company won’t put it this way, but the goal is to build a “mini-Disney” (to be fair, that’s the dream for nearly everyone in the sector). A universe of characters and stories you can re-adapt at will.
Its most recent release is an animated series on their YouTube channel, KABU. At last count, views topped 2 million and reportedly drove more than $1M in plush sales (yes, through Kabu Mini Beans).
All of it currently serves mostly to sell plush. Net capitalized entertainment assets are worth only $4.5M on the balance sheet. But what matters is that customers buy the plush, and they do, just not all of them the same way.
2.5 The Customers: From Kids to Kidults
At its opening in 1997, Build-A-Bear is a workshop for kids aged three to eight, planted in a shopping mall. The shift happens in the 2010s: the brand stops aiming at the child alone and goes after the teen, the adult who gives gifts, and the adult who collects. Today close to 40% of sales go to teens and adults, elegantly labeled the “kidult” segment. The company grew up with its audience.
This isn’t a BBW quirk: kidults now make up nearly 28% of the global toy market.1 BBW’s place in that segment, what weapons it plays with, and against whom, that’s the job of Part 6. For now, the point to keep is that BBW went from the 3-to-8 segment to the 3-to-45 segment, and the more time passes, the wider that segment gets.
Ages vary widely, and so does behavior. Let’s break it down.
The store is mostly for kids, their families, and young teens. The first driver is birthdays and parties: more than a third of revenue revolves around them. A birthday doubles as a showroom for every kid there. Among the twenty-odd children and their families who came for the party, some will come back, maybe even for their own birthdays, with other kids. The second driver is the store itself. The store is built to be its own display window, whether it sits in the middle of a mall walkway, inside a store that breathes childhood, or in a tourist destination.
Online, you shift to the near-adult teen and to adults. Both can be either collectors or there to give a gift. Hence the Bear Cave. The occasions are more varied: a new baby, the holidays, a graduation, but above all, Valentine’s Day. Bears appeal to lovers enough that Valentine’s Day became the single biggest sales day in the brand’s history in 2026.
The inevitable gift card is in the mix too, and it’s not trivial. As always, it adds a few accounting subtleties not worth getting into here. Either way, the revenue gets booked at some point, whether the card is spent or not. $6M in unredeemed gift card revenue last year.
Tying it all together is the loyalty program, the “Bonus Club” ($1 spent = 1 point). To join, you hand over some data, which translates into a customer base the brand owns outright to fine-tune its marketing and its offers. 8 in 10 Americans know the brand (I’ve been holding back the word moat this whole time, but come on... oops), so marketing serves more to maintain existing affection than to create it.
That marketing happens everywhere: owned content, licenses, email, and above all, social media. Close to a billion views when the company dropped its Baby Yoda plush. Strings of shorts racking up tens of millions of views each (some sponsored, some not), made by moms or young “influencer” couples. But this social-media marketing mostly serves the owned-store sales; for e-commerce, the advertising runs mostly online. Speaking of points of sale.
2.6 The Doors: Stores, Formats and Franchises
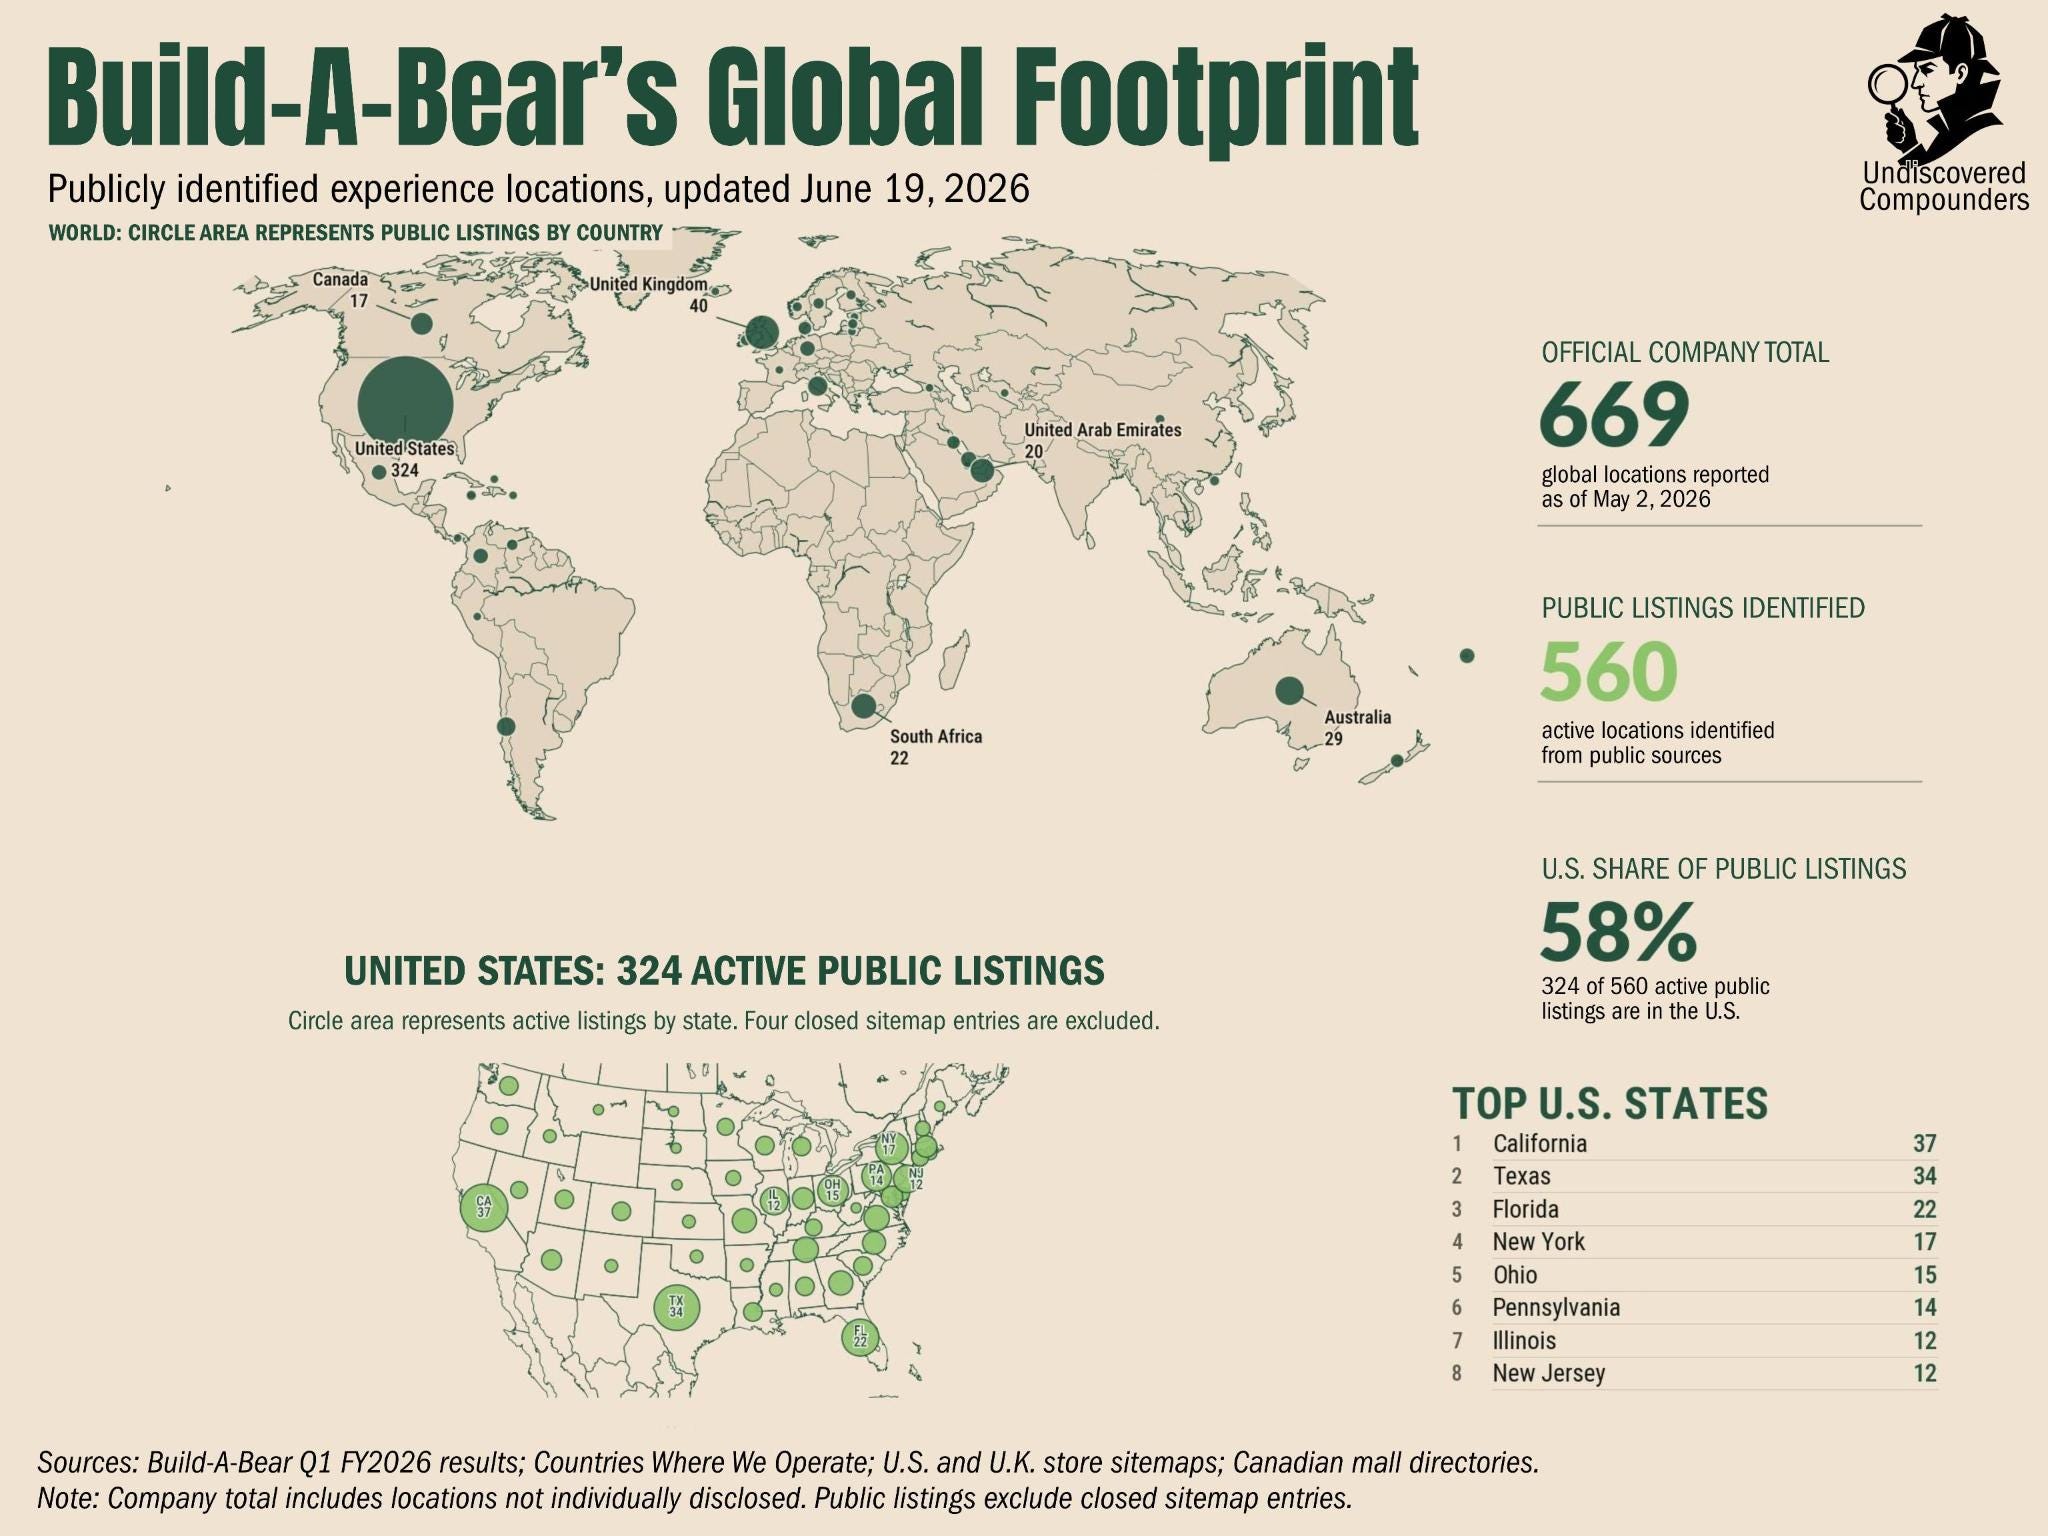
The doors are many, and the count is instructive. As of January 31, 2026, Build-A-Bear has 662 locations worldwide:
375 corporately owned, of which 333 in the US and Canada, 42 in the UK and Ireland.
178 are third-party operated. Think of it as grafting the BBW experience inside someone else’s destination: cruise ships, zoos, theme parks, and so on. BBW sells the merchandise and the turnkey experience, and the third-party operators run the place, pay the rent, and carry the risk. The vast majority of these locations are in North America/UK.
109 are international franchises. Here, a foreign operator pays for the right to open a store with the Build-A-Bear brand and products. These third parties run the place, pick the location, negotiate the lease, pay it, and so on. In short, once BBW grants them the right to use its licenses, they’re the ones making the decisions, taking the risk, and weighing down their own balance sheet. BBW sells them the merchandise and the turnkey experience (BBW’s only upfront capital outlay). It’s an extension of the BBW brand, so the choice of operator matters to BBW, all the more since one operator often runs several BBW stores in the same country.
As for size: “So we have formats that we can operate from 200 square feet to 10,000 square foot locations profitably.” (Conf Call, Q3 2024)
Within that range, a whole variety of formats:
Traditional Mall Store. Full-format big footprint in the mall. It was dominant in 2015 (90%+ of the mix), now a minority (this detail will matter a lot in the next part);
Discovery Format. A modernized version of the Traditional. Smaller, with a redesigned layout and better productivity per square foot. It’s the majority of the current mix (about 54%)
Concourse shop. Around 200 sq ft in a mall corridor (no walls to rent). The idea is very flexible leases and, above all, almost no capital. The aim is mostly to create brand exposure cheaply and with high versatility
Shop-in-Shop. A store inside another retailer. Typically a corner of a Walmart. BBW sells its own BBW products in its corner of the store. This is different from the partnership where Walmart itself sells BBW products on its shelves.
Tourist destination. The name says it. BBW is an experience, and it overperforms where people are already buying experiences. It’s been one of the DTC drivers for a few years now.
The multi-level flagship. Just one of these: Orlando’s Icon Park, designed as an attraction in its own right in a tourist zone. It opens H2-26.
Seasonal. This one’s for the short term in specific situations. Leases, usually small, from 2 months at the shortest to 18 months at the longest.
BBW doesn’t own the walls of any of its stores: it leases them all. So it has to negotiate its leases. But a brand that pulls in customers is a brand that pulls in landlords too. One of the big variables that reshaped BBW is its leverage in negotiating leases: “particularly in the post-covid environment, where we renegotiated practically every single lease. And I think that utilizing the power of the brand has leverage, and I believe we’ve done a very good job at that” (Conf Call, Q3 2024)
Let’s unpack this a bit, because it’s one of the biggest variables on the balance sheet. Most leases index rent to activity: a base rent plus a variable piece that kicks in beyond an agreed annual sales threshold. Some drop the fixed part entirely, and the landlord then takes only a percentage of the store’s revenue. When a location slows, the rent slows with it. Many leases also carry a sales-based exit clause, over two windows: years three to four, then years six to seven, exercisable depending on the case by the landlord or by BBW.
In North America, the term was deliberately shortened to realign the fleet faster: that flexibility is one of BBW’s strengths. But it has a price: if commercial rents are higher at renewal, BBW will pay more in the vast majority of cases. In the UK and Ireland, it’s both simpler and more constraining: leases reset every three to five years, aligned to the market but “upwards only.” So base rent can rise but never come back down, even when the market turns. Remember, this is a minority of the company's directly operated stores.
Alongside, the digital side: buildabear.com, the Bear Cave, the marketplaces; and since a web order is picked up in store as often as it’s shipped, click-and-collect in the UK and Ireland, in-store pickup in the US, every store also doubles as a mini-warehouse.
Since this spring, the shelf space of 1,500 Walmarts all at once. And, at the far end, outbound licensing, which puts the brand’s name on shelves it will never run. E-commerce depends on the stores logistically, but the physical stores also depend on e-commerce: “Most of our guests, from what we can tell [...] have a tendency to go online first [...] find a store, plan a visit, plan a party - [these] web pages are our largest visited web pages. So we know that the guests are using our buildabear.com as a source of information and planning for their store visits.“ (Conf Call, Q2 2025)
That’s the present; for the future, the trend is clear: 64 net openings last year, only 7 of them owned, 40 with partners, 17 franchised. They’re guiding for around 50 new locations in 2026. Worth noting the international footprint went from 19 to 37 countries in two years. Enough to soften the blow of the gloomy US consumer. For owned-store growth (so North America + UK + Ireland), the market is probably close to saturation (management will obviously never put it that way). Growth in that segment very likely won’t come from store count.
2.7 The Unit Economics
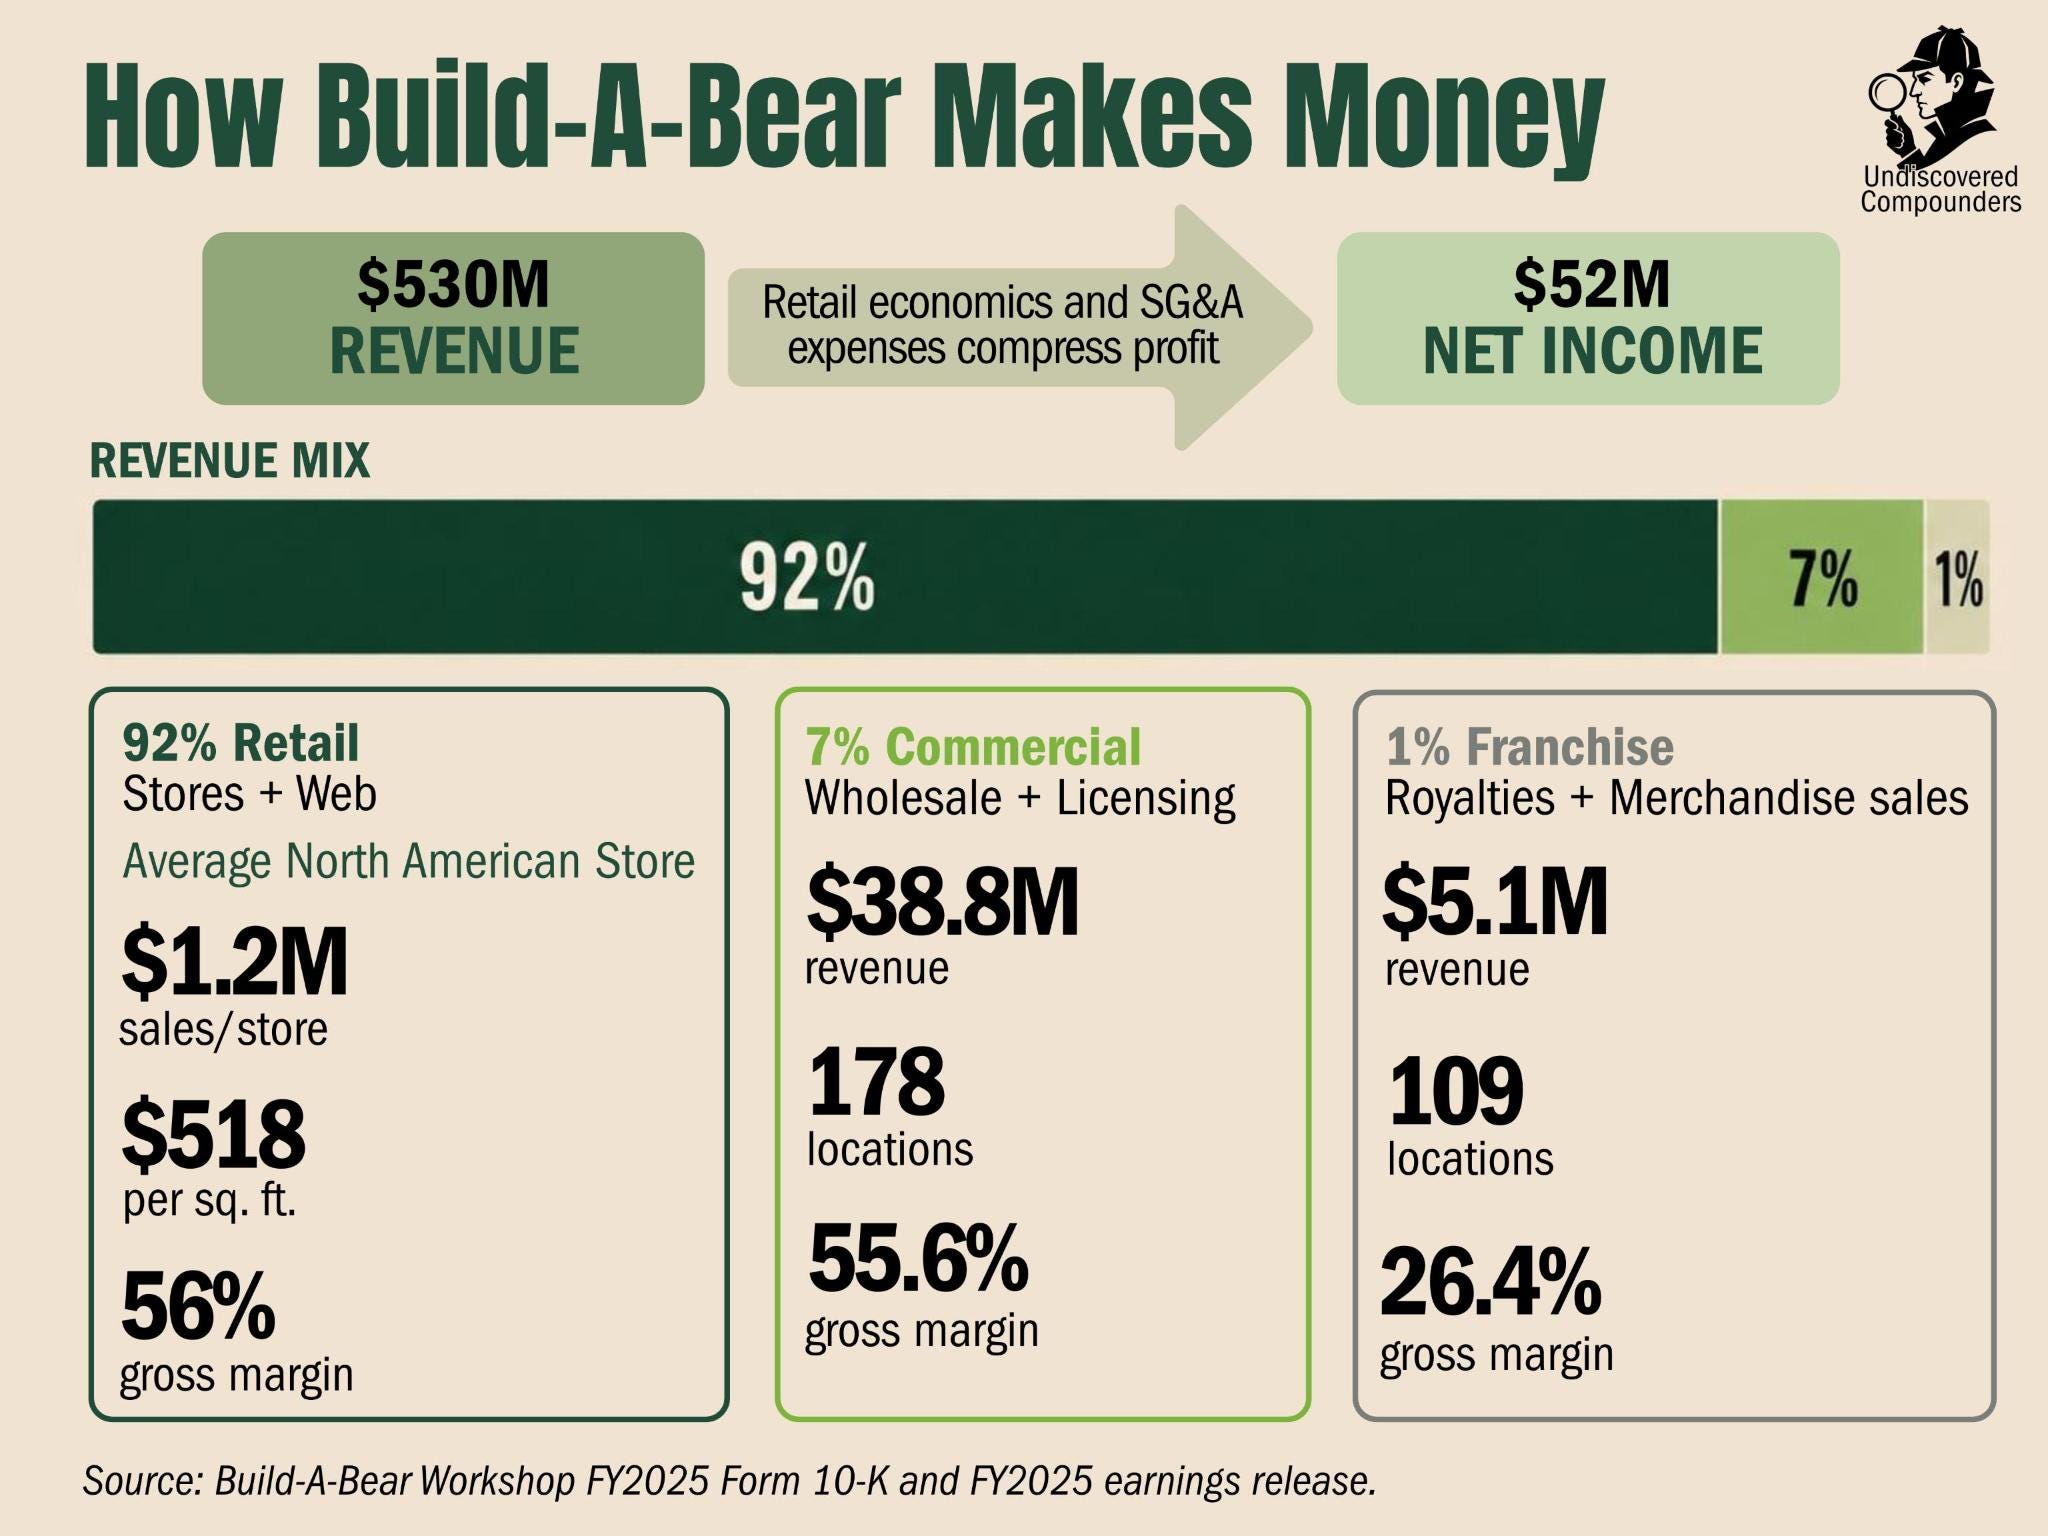
$530M in revenue last year, for net income of $52M. Why only $52M is the job of Part 5. The company files that figure under three segments:
retail, stores and web combined, 91.7%
commercial, wholesale and outbound licensing, 7.3%;
international franchise, almost pure royalties, 1%.
This revenue split hides a lot of important things, but we’ll keep that, too, for Part 5. For now, let's keep it descriptive. To set the scale of one unit: a North American store runs around $1.2M in sales a year, about $518 per square foot, at roughly 56% gross margin.
The company’s economic strategy comes down to four pillars:
Organic sales growth by widening the audience (collector kidults in particular) and by raising the basket (price and units per transaction)
Location expansion, mostly asset-light internationally through franchises. Last quarter there were a few “closures,” but mostly format upgrades or relocations.
Wholesale and brand licensing. Wholesale = selling the pre-stuffed products in 1,500+ Walmarts (note also a Los Angeles showroom). Brand licensing = letting outside manufacturers and distributors sell products tied to a brand BBW owns. This is different from a franchised store. It’s the same as when BBW pays a royalty to Nintendo to make its own Pokémon plush, except here BBW is the one getting paid for others to make and sell its brands as plush. The main brand involved here is Honey Girls.
Gifting and personalization. The idea is to push the brand beyond the childish in-store experience toward the gifting occasion, to stretch the moments of “consumption.” If I drop the management-speak filter: get adults to buy more often.
I’d file 1 and 4 under intensive growth (more value per customer in mature domestic markets), and 2 and 3 under extensive growth (generating other revenue streams). But we’ll get into the numbers later.
There’s only one thing left to see to understand the business: behind the scenes.
2.8 Behind the Scenes: Supply Chain and Operations
You won’t be surprised to learn that Build-A-Bear makes nothing itself: it buys three-quarters of its plush from five suppliers, based in China (a little over half) and Vietnam (the rest), after patiently cutting a China dependence that ran above 90% before 2020. The diversification only lasted so long: China and Vietnam were among the countries hit hardest by tariffs (we’ll come back to it in detail, count on it).
It doesn’t manufacture, but it answers for everything: toy-safety compliance, independent lab testing, factory social audits, and so on. After the various children’s-toy scandals of recent decades (look them up, it’s worth it: little beads, say, whose coating turns into GHB once swallowed), these constraints weigh on gross margins (but it’s a fixed cost you can’t optimize away, so be it). Its track record is reassuring: only 6 minor recalls, one of them in early 2026 (nothing significant).
As for logistics, it owns a 350,000-square-foot warehouse in Groveport, Ohio, plus three other centers (California, England, and Shanghai) run under third-party management. Around 1,200 full-timers and 4,300 part-timers depending on the season to keep all this machinery running (excluding franchises/partner-operated). A single store is unionized (end of 2025).
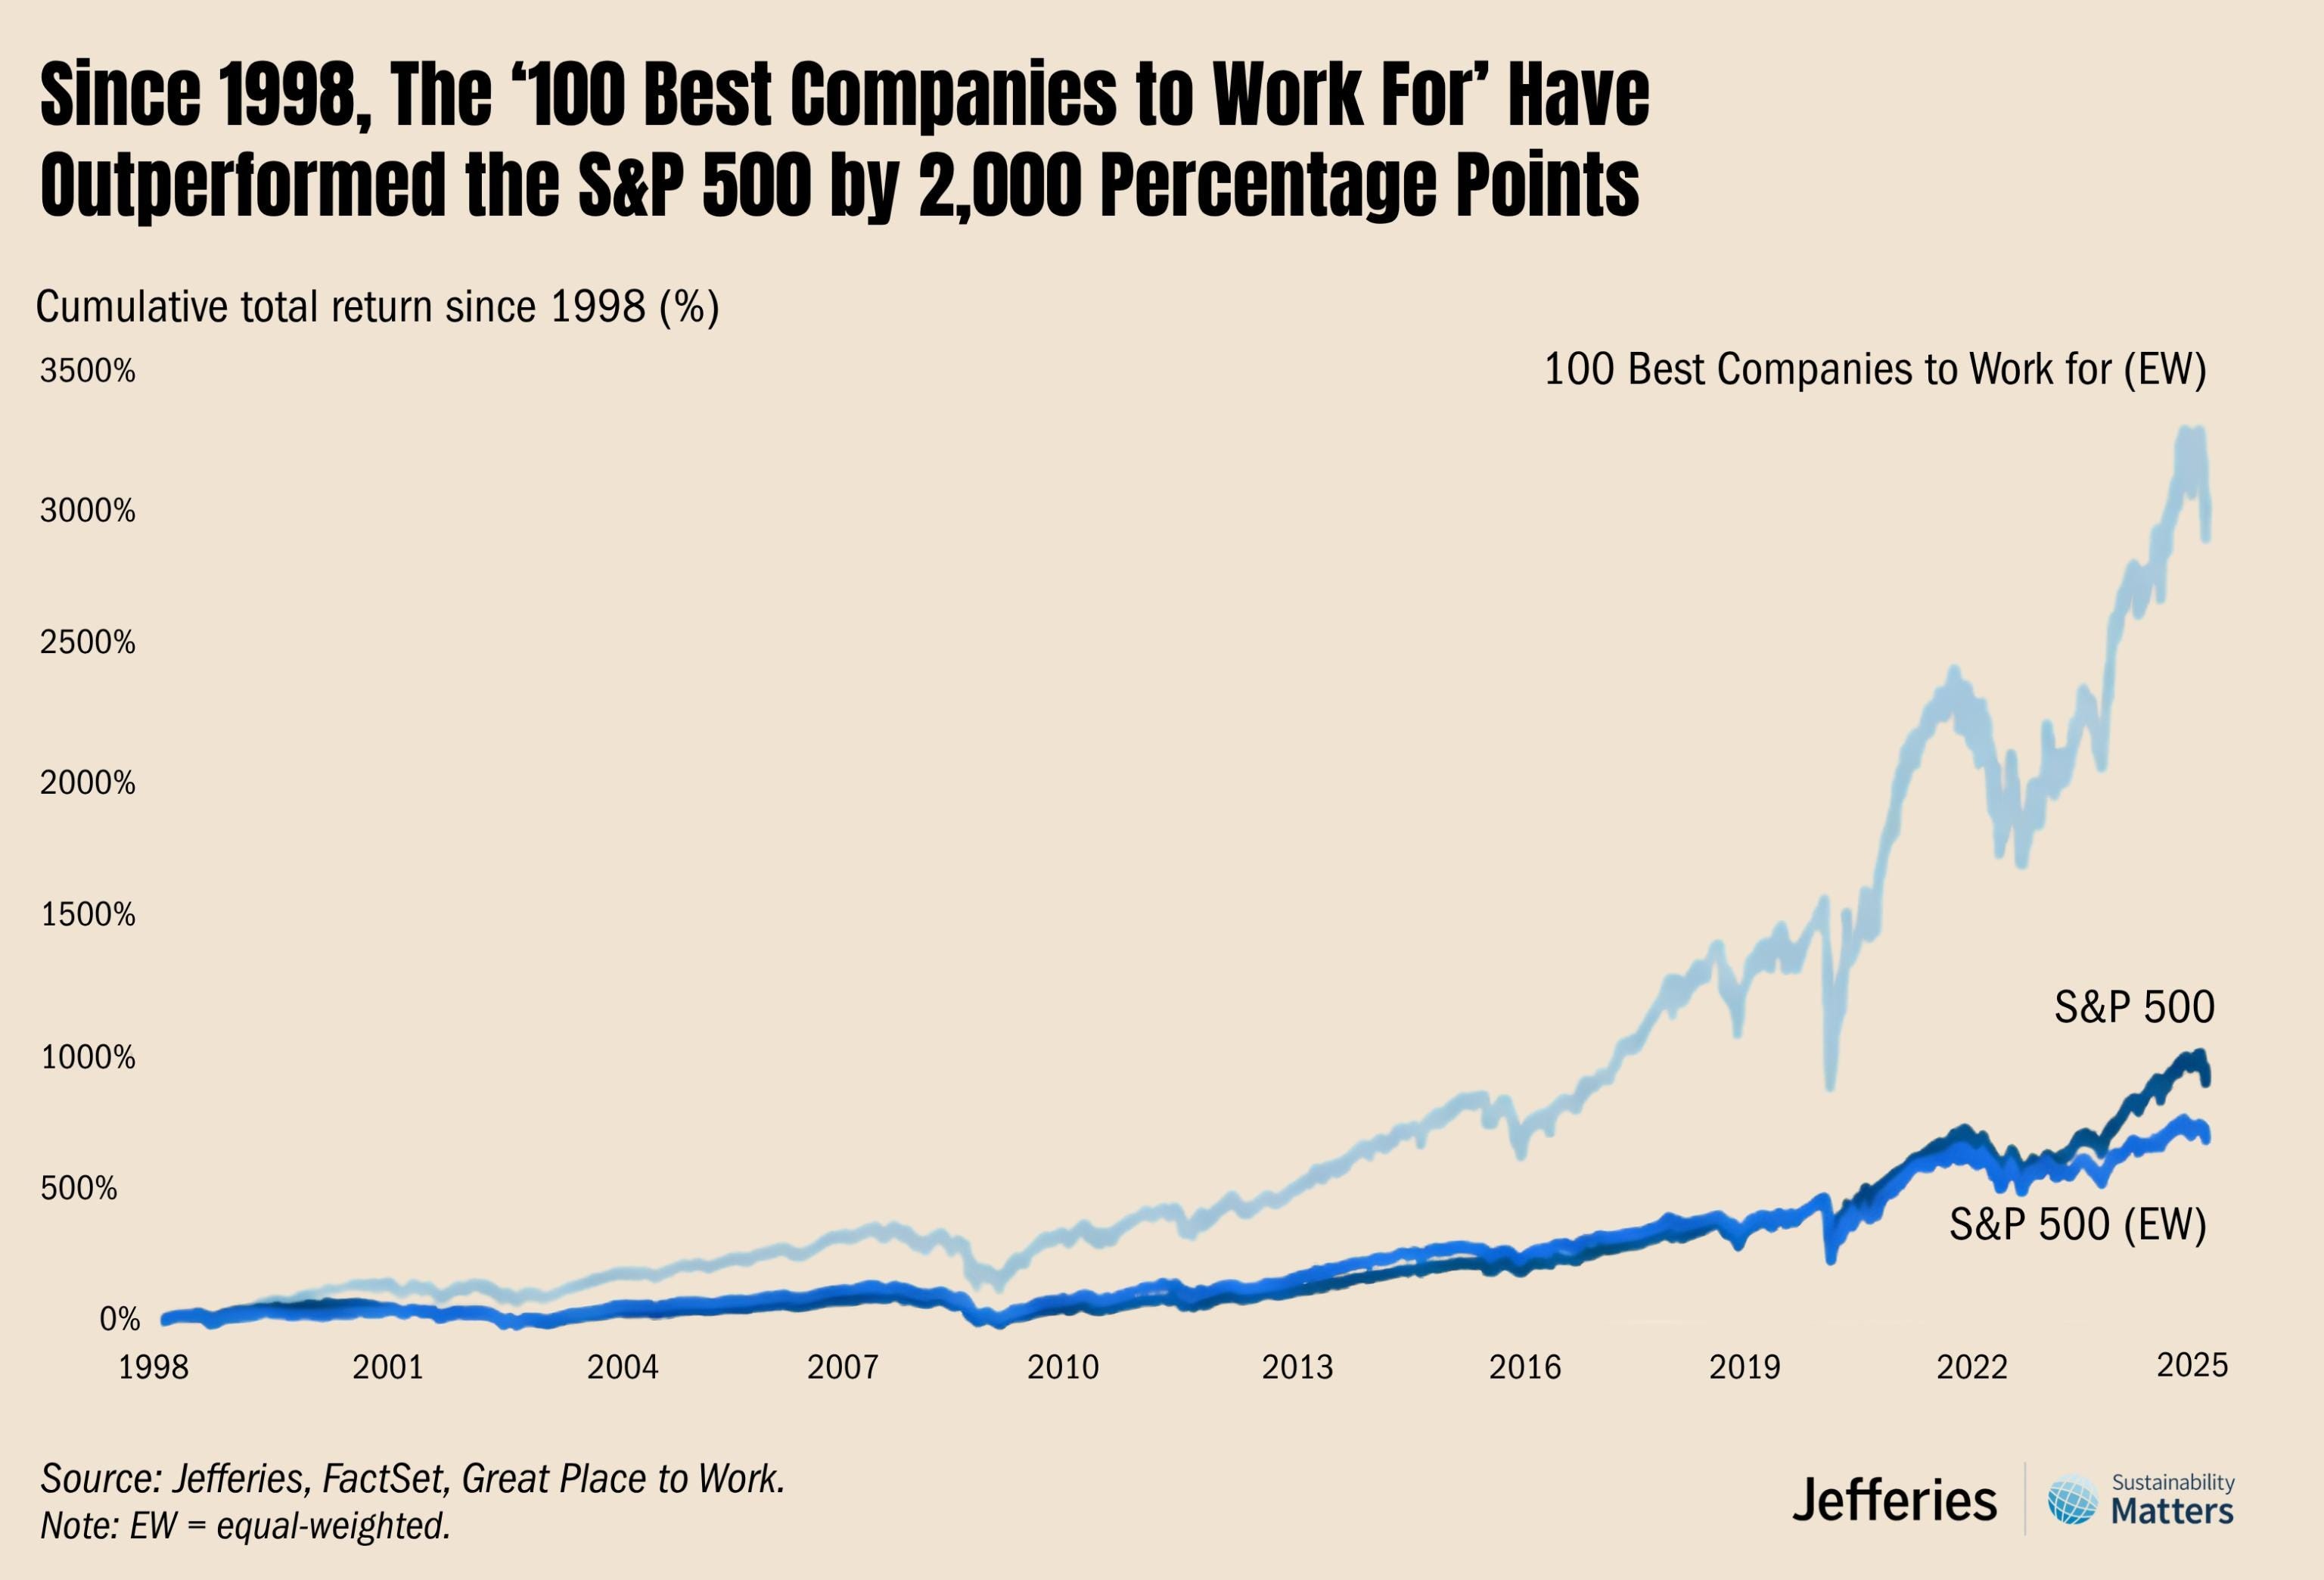
The company tends to its reputation as an employer, and it shows: on Fortune’s 100 Best Companies to Work For list for a decade, through 2018, and singled out again by Newsweek in 2026.2 That’s anything but trivial. Value creation is a human business: happy employees are more productive employees, and that carries through to customer satisfaction.
For the doubters, the Fortune 100 Best Companies outperformed the S&P 500 by 2,000% over the last 27 years (note that BBW was literally part of that light-blue line for 10 years).
2.9 Competition
Who are all these happy employees fighting? The 10-K distinguishes two types of competitor (I’ll add a third):
The typical toy seller: Ty, Jellycat, Hasbro, Mattel, Lego, Amazon, and so on. The publicly listed ones are Hasbro, Mattel, Pop Mart (the Labubu people), and Funko (thank Private Equity and its healthy appetite for this kind of company for the thin list of comps). Call it “toy competition.”
Next, the company also competes against everything “that fights for leisure time and budget.” Think movie theaters, restaurants, theme parks, zoos, and so on. Call it “experience competition.”
Finally, the company competes against every business fighting for the best spots in malls and tourist locations. Call it “location competition.”
Three circles of competitors, and not one of them really doing the same thing. Here’s a broad map of the sector’s competition. It’s neither exhaustive nor the final word.
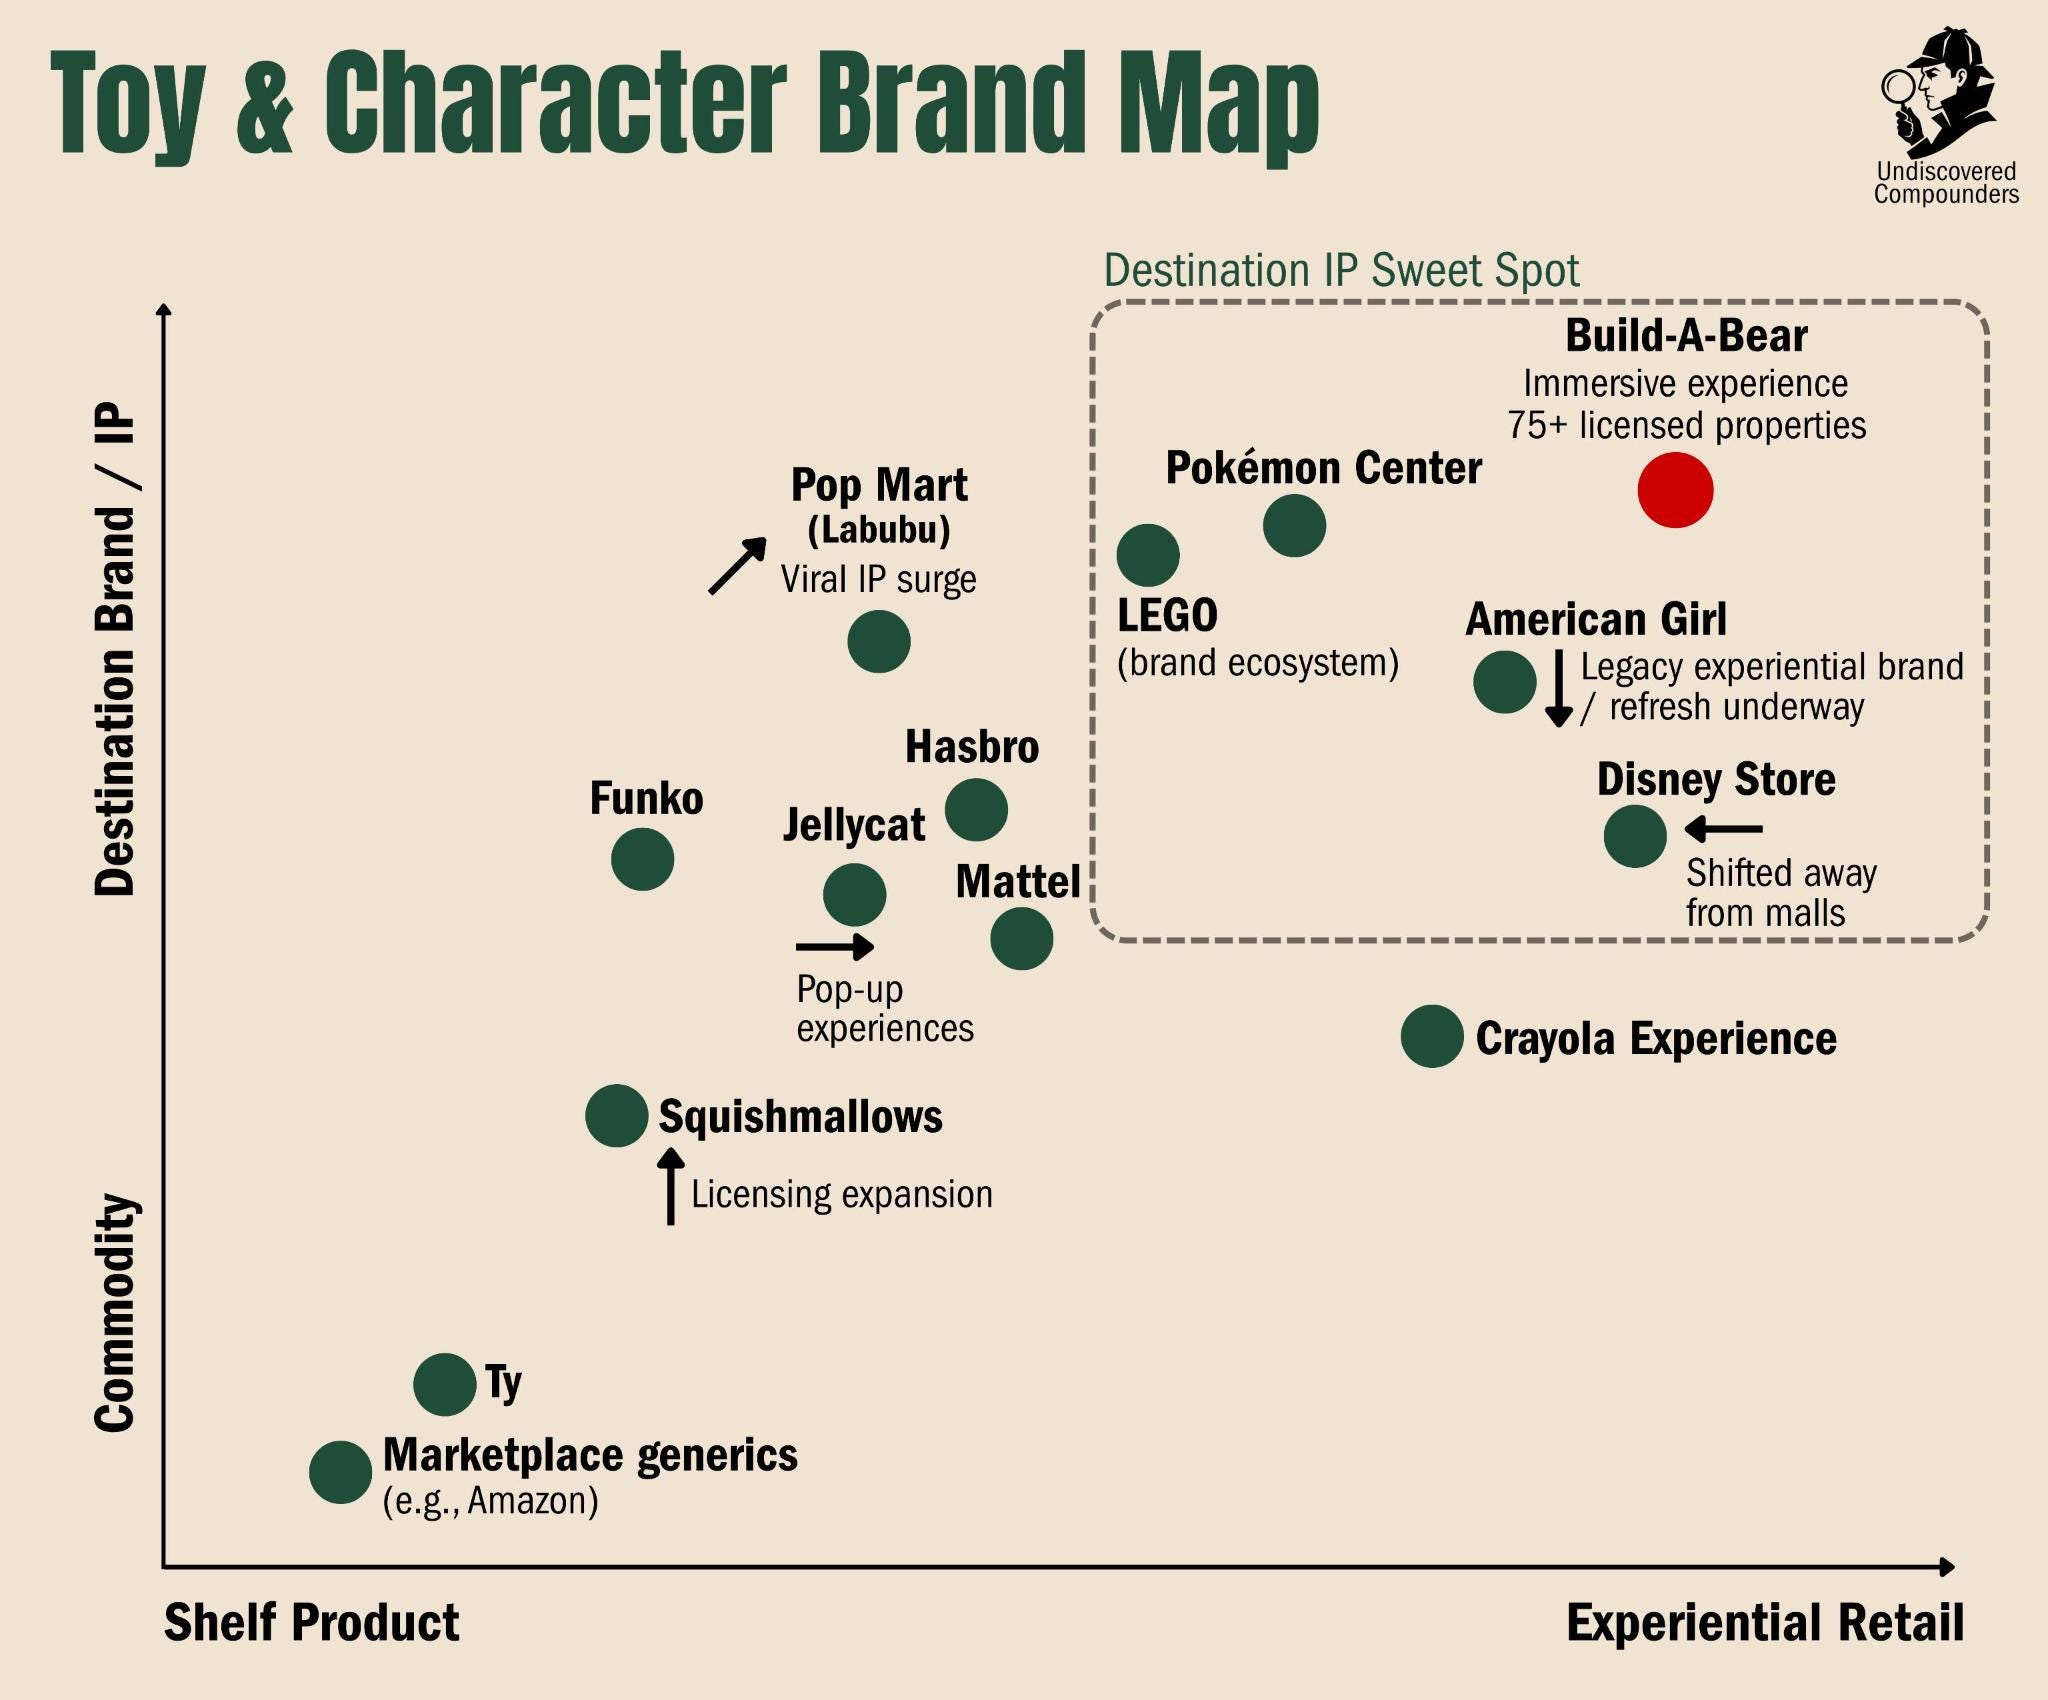
As for toy and location competition, the close competitors number in the hundreds. On the experiential side, direct competition is more limited but also more direct: a family can hit a restaurant and then the BBW next door. The odds they go to the Lego store and then to BBW are much lower. For location competition, it can be against just about anything.
If you overlay the circles (experience, toy sales, location) and factor in size/geography, the most relevant comp in my view would be Lego. But Lego isn’t publicly listed. The Hasbro and Funko comparison is too limited on too many variables. The least-bad comp is still Mattel: similar margins, cash flow generation, and valuations (around 6x EBITDA on both sides). But operationally, they’re still pretty different animals.
The real comp for BBW is BBW itself. That’s the one I’ll use for almost all of the rest of this deep dive. Beyond the too-distant resemblances and the thin public information on the candidates, the decisive argument is that a competitor can also be a partner.
The best example of all this is the BBW store partnered with Hello Kitty. Sanrio, a competitor in the sector but also a longtime BBW partner, opened a store built on the Hello Kitty IP but recentered on BBW’s make-your-own experience. BBW doesn’t own the concept, they only invented it. Anyone can sell make-your-own plush and slap their own IP on it. Sanrio could have done it alone. Instead they chose to do it through a partnership with BBW. Why? Because BBW has outgrown its own concept; it has become a brand in its own right, one it can be operationally and financially worth teaming up with. It shows BBW’s unique place in the ecosystem, and how a global competitor (in the toy segment) can be a partner in the specific. Since 2026, two more stores partnered with Hello Kitty and Friends, directly operated by BBW, have opened.
To sum up, BBW is:
A brand that industrialized a moment of attachment and resells it at every price, from $10 to $100+;
Available at every age, from the crib to the office.
Through every door, from the store it owns to the Walmart shelf, from the cruise ship to the screen;
Under almost every license, from Pokémon to the NFL, all the way into its own films.
Spreading across the world through franchises that cost very little capital.
Whose growth comes mostly from franchises/partner-operated and from the commercial segment (wholesale & licensing).
To sum up the summary, BBW is a very good idea, building your own teddy bear, pushed to the end of its combinations. Add a dose of collectibles and licenses, mix it all to taste, and you’ve got today’s BBW.
Now that we have a good picture of the company, one thing remains to describe: the macro backdrop BBW operates in.
Hedge funds pay tens of thousands for a thesis like this, then keep it to themselves. Want a good chunk of that, regularly and for free? Subscribe.
3. The Macro Backdrop
3.1 The Context: Consumer Sentiment
You probably know this already, the macro backdrop is... complicated. Gloomy, the US consumer would say. In May 2026, the University of Michigan consumer sentiment index drops to 44.8, the lowest in the whole series3, which is nearly 50 years old. It bounces to 49.5 in June but stays 19% below where it was a year ago.4 The Conference Board tells the same story its own way: 93.1 in May, down, with two in three households saying they’re cutting back.5
Digging through the data, you can date the trigger of this record low: in spring 2026, the flare-up between the United States, Israel, and Iran sends crude soaring. Gasoline tops $4 a gallon for the first time since 2022, a dollar more in a single month (+35%), the most brutal monthly jump in decades. Worse than Katrina and worse than Ukraine.6 On an already tired consumer, it’s one tax too many. My take is that the uncertainty tied to AI, and to a world changing faster than probably any time in human history, helps make the consumer a little more uncertain and uneasy.
What’s objective is that the safety cushion is thin. The household savings rate fell to 4% in Q1-26 (vs 6.2% two years earlier).7 Enough to absorb one surprise at most. Meanwhile, credit-card debt is brushing its record, at $1.25T.8 Delinquencies are rising, concentrated in the most fragile borrowers. Nearly 1 in 5 student loans are now delinquent.9 In short, the American consumer has few reserves and a lot of debt.
Okay, that’s the macro backdrop painted Francis Bacon style, but mood and behavior aren’t the same thing. The gap between the two has never been wider.
3.2 The Behavior: How Consumers Actually Spend
Retail sales rose 0.5% in April and 5% year over year.10 Unemployment holds at 4.3%, with positive job creation and wages up (3.4%).11 Clearly a different picture. And that fear doesn't stop them from spending. For now, they're at the stage of picking and choosing.
That trade-off is clearly directional. In January, services spending rose $105.7B while goods spending fell $24.6B.12 The signal is in the detail. Apparel and footwear lose ground, autos (and gasoline, obviously) lose even more. To be fair, this trend has been around since Covid, but 2026 saw it accelerate. 75% of Americans say they get more value from an experience than from an object, and more than half feel they own too much stuff.13 So when confidence drops, or budgets tighten, the object gets sacrificed for the experience.
This shift claims victims, to the point where the retail picture is starting to look like a graveyard. More than 8,000 chain stores closed in 2025, and the same number is expected in 2026.14 Retailer bankruptcies keep coming: QVC (nearly $7B in debt)15, Eddie Bauer (175 stores)16, Francesca’s (more than 400 stores liquidated)17, and I could go on for a while. What they have in common: sellers of undifferentiated goods and apparel. Meanwhile, US mall traffic is climbing (3.5% for open-air centers vs 2.2% for enclosed malls)18, the real winners being the ones filling up with experience and dining (I know, dining is an experience, but I mention it because its share of the experiential is very significant).
One big uncertainty remains, this time on the corporate side: tariffs. On February 20, the Supreme Court struck down a good chunk of the tariffs imposed by the Trump administration, opening the door to some $170B in refunds.19 No surprise, the administration hits back at once with a 10% tariff on everything under Section 122.20 For our purposes here, China stays taxed around 17.5% and Vietnam around 10%.21 For anyone who imports what they sell, which is to say nearly all of American retail, that cost line is a high-variance variable.
To sum up, a hesitant consumer, but one still spending, dropping the object for the experience. On top of that, import costs you can’t model with enough certainty at 12 months.
For BBW, which sells both experience and physical goods, the picture isn’t obvious. The string of records is clear, but the weaker quarter, the lowered annual guidance, and the tariffs add uncertainty.
The “truth” is in the digging and in weighing the variables against each other. All the better, otherwise the opportunity, if it is one, probably wouldn’t exist. The digging starts with understanding BBW’s history and how its business model was built and evolved.
4. Build-A-Bear’s History, Brick by Brick
4.1 A Study in Pink: The Founding and First Boom (1997-2007)
The first brick is the most important: a whole new category. Maxine Clark, a former Payless executive, opens the first workshop in the St. Louis mall in 1997.22 The idea reportedly came from her neighbor, a ten-year-old who was hunting in vain for a trendy stuffed animal and who, with childlike originality, supposedly said: “why don’t we just make it ourselves.” Clark tests the hunch on a panel of kids, pays a design firm to refine it, and sniffs out the essential: a plush costs $5 to make and can sell for $50.
The first store is a smash: the line spills into the parking lot, $400k of plush in a few months, up to $600 in sales per square foot.23 Clark was one of the pioneers of a new genre, “retailtainment”: not quite a store, not quite an attraction. The word itself wasn’t even coined until two years later.24 The potential is obvious to Clark, and soon obvious to everyone. The next step has to be to lock in the concept fast by scaling.
The second brick, then, is scale, and she executes it almost perfectly. $5M raised for 11 stores in 1999, then 100 in 2002, an IPO in 2004, and soon a Build-A-Bear in nearly every American suburban mall. In 2007, revenue peaks at $470M. The concept is good, but the timing was perfect: baby-boomer parents who liked spending on their millennial kids, who were crazy about personalizing everything. Hard to imagine a better start.
Competition shows up anyway. On paper, after all, the concept isn’t hard to recreate. The Bear Factory, launched by Hamleys in the UK25, clones the model fairly “closely.” Close enough to try to register the name “Build-A-Bear” (already taken, of course) before ending up bought by BBW itself in 2006 for $41M.26 That’s the origin of its sizable UK footprint, and in hindsight it was objectively the best call. The brand didn’t yet have enough weight to take on competition abroad, and the acquisition let it export the brand into a country culturally very close to the US, so probably just as receptive. Another notable direct competitor, Teddy Mountain, launched in 2003, climbs to 120 stores27, then abandons retail for wholesale kits for zoos and parks after 2008 (for lack of profitability).
The irony is that even its inventor stumbles on it: in 2005, BBW, probably drunk on its own success, thinks it holds a universal recipe and extends it to dolls, the “Friends 2B Made,” which it shuts down by 2009. Those 4 years may seem harmless, but not if you read the filings from the time. F2BM very quickly performed well below management’s expectations, and an efficient capital allocator would very likely have killed the project much sooner. The seeds of the future disaster were already there, even visible: Clark stayed locked into the strategy that had grown BBW, and was very resistant to change despite the feedback, sometimes obvious, from reality. The subprime crisis would put all of it on display. The idea to keep from BBW’s first decade is that the concept can be copied, but not everything around it. And it’s the “around it” that creates the value.
4.2 The Valley of Fear: Crisis, New CEO and Turnaround (2008-2019)
The BBW of 2007 was built exclusively on malls, and those were about to die en masse. The subprime crisis, sure, but also e-commerce taking off, the iPad in 2010 concentrating kids’ (and some parents’) leisure time onto a single device. Revenue falls from $470M to $380M, and fiscal 2012 ends in a $49M net loss, a good half of it from writing down the British goodwill. The valuation drops to $50M. It was priced as dying, and to be fair, it was.
Faced with losses like that, the board had to act. In 2013 (only in 2013, read the conf calls, it’s almost painful), Maxine Clark, whose official title was “Chief Executive Bear” (not gonna lie, I find that pretty cringe), steps down. The board goes looking for a turnaround specialist, Sharon Price John. Before the shoe company Stride Rite, she spent years at Hasbro and Mattel, keeping licensed toys alive (Star Wars, Disney, and so on). To fix Build-A-Bear, the board bet on a brand-and-licensing specialist.
John arrives and spends weeks analyzing the stores, line by line. Her read is clear: the business is broken, but the brand isn’t. So she puts on her turnaround hat and closes 50-60 money-losing stores in two years. She relocates some, shrinks others. She’ll say what stunned her most at the time was that 5% of sales were online, at the height of e-commerce’s golden age. She relaunches e-commerce right away and puts her omnichannel strategy in place. A few weeks to map every hemorrhage, a few months to stop them, and a few years to repair the foundations. Then she could prepare for the future. Clark, the former CEO, was locked into her strategy centered on the in-store experience and growth through store count. It was her baby; shrinking it or significantly reorienting the strategy meant contradicting years of decisions, with escalating commitment. A new CEO was the only cure.
John makes another observation: the kids of 1997 have become adults. According to the stats, they’ve even become nostalgic. And nostalgia can be bought. She steers the sales and marketing strategy beyond young children. 8 years later, the teen-and-adult share has gone from a trivial slice to 40% of sales in 2022, above the sector average. And that nostalgia keeps growing among the new adults. It changes the business model deeply: the customer is won in childhood and stays won while growing up, switching channels (now a collector, he gives one to his boyfriend or girlfriend, then brings his future kids back, and so on). So over the years the company becomes a multigenerational annuity.
To feed that broadened audience, John triggers her licensing reflex. Build-A-Bear becomes the canvas the biggest names land on: Marvel, Disney, Pokémon, Star Wars, the NFL. The announcement of a Grogu bear, the Mandalorian’s “Baby Yoda,” pulls in nearly a billion impressions in a few days, and the bear sells out in two hours. Every major license is a door that closes on the copycats: a kiosk can stuff a bear bought in China, but it can never dress Darth Vader (legally). The company pushed the logic further and makes its own characters, through Build-A-Bear Entertainment: films, in-house heroes you don’t have to rent and whose margin you keep entirely. That segment stays relatively marginal for now.
Meanwhile, BBW leaves the dying malls for the places the customer actually is, kiosks, tourist zones, cruise ships, up to 35% of sales outside the mall by 2022. BBW is a brand businesses want, and it finds its place just about wherever it likes, often with strong negotiating power. Alongside, it opens a back door for adults, the Bear Cave.
Each of these initiatives was one more brick, pushing the would-be imitator further away. The wall becomes a moat in its own right, and each additional year fortifies that moat.
There was still one big misfire. In July 2018, a “Pay Your Age” promotion (pay for your bear at the price of the child’s age, sometimes called “Count Your Candles”) draws crowds so dense the stores have to close for safety, 1,500 people in the Manhattan store alone (I did the math, that’s 6.3 people per square meter, a critical-level crowd density). The year ends in a loss. It was a very particular moment that gave away two very important things:
The brand was powerful enough that its demand spilled past its own walls: the moat was even wider than assumed.
But the business was still fragile enough to lose money anyway: the rebuild was far from finished.
They’ll keep running this promotion in a more controlled way (it still exists), and each time it remains one of the best ways for the company to get itself talked about (directly, or through its customers on social media). Above all, the promotion requires people to sign up for the Bonus Club loyalty program, which not only builds a bit more loyalty but, more importantly, captures their information (email, phone, age, child, and so on) to run extremely targeted ad campaigns. That’ll matter later.
4.3 The Adventure of the Second Stain: Covid and the Record Run (2020-Today)
Then comes the trial by fire, Covid, the lockdowns and store closures. On paper it’s the worst-case scenario for a business that makes the product on site. And this is where the successive bricks John laid over 7 years, without ever thinking of a pandemic, literally save the company:
She renegotiates a large part of these leases to lighten the balance sheet substantially.
She goes all-in on the e-commerce she’d built up over the previous years.
She reorganizes the logistics of her click-and-collect, maximizing efficiency while using the entire network of empty stores.
Customers order their bears online, pick them up, and BBW survives. The year takes a $23M loss. The next year, the company posts $47M in profit, its best year. BBW reaped the fruit of those hard years of rebuilding John put in place, at what looked like the worst moment in the company’s history. It not only survived, it came out of Covid stronger than ever. The nostalgia economy that followed the end of lockdown finished transforming the company.
BBW survived the subprime crisis and an ill-fitting operating strategy; it took nearly 10 years to rebuild, which is what let it survive its second-biggest crisis. The company went from a broken business (but a working brand) to a very good business and a brand at its peak. I read all these changes quarter by quarter, conf call by conf call, and I’ve rarely seen a turnaround executed this well. Shareholders at the time expected a 2-to-3-year turnaround, but John knew getting the company back afloat would take much longer, and made all the hard decisions to create long-term value.
Also worth noting in this period the influence of activists: Cannell (Cannell Capital LLC), and above all Kanen (Kanen Wealth Management LLC), who helped turn a very good business into a very good business that rewards its shareholders. It was in fact in Kanen Wealth Management LLC’s 13-F that I discovered Build-A-Bear, and took part in what would become one of the great shareholder runs of the era. I actively encourage you to keep an eye on their largest positions regularly.
From there, the machine is running. The company strings together years of record revenue. Slight stagnation in net income in FY24 and FY25 (we’ll see why later), but EPS keeps setting records thanks to buybacks. The company has paid dividends for 2 years. The moat now expresses itself in two “currencies.” Price, because an inimitable brand makes you pay for its name (fine, it’s still a toy retailer, we’re not talking ASML pricing power). And capital, because third parties compete for the right to operate the banner to the point of funding its growth: 57 of the last 64 net openings were on a third party’s balance sheet, with franchise payments. You don’t rent out merchandise.
That’s how the moat was built, brick by brick:
a new category,
a scale that absorbs its clones,
a near-shipwreck that proved the brand outlived its business,
a rebuild that filled the hole and then, on top, widened the gap,
gone multigenerational,
licensed from the biggest names,
fed by its own licenses,
operated in part by others who pay for the privilege.
The consequences of this moat for the present and the future are the more or less direct subject of the parts that follow. But I want to quote the former CEO, which gets at the essence of those consequences: “we believe that we have the opportunity to appeal to more people, in more places for more products and more occasions.” (Conf call, Q3-25)
I’d call that a halo effect.
We’ve finally covered the qualitative. Time for the numbers.
5. The Financials
Time to keep several promises I’d put on hold.
Before we start, two important clarifications:
I use the company’s calendar: the fiscal year ended January 31, 2026, is FY2025. The quarter ended May 2, 2026, is therefore Q1-26. Aggregators like Tikr and the rest shift everything by a year.
A word on the calendar, because it’s a trap: the fiscal year ends in late January and runs one extra week roughly every six years (last time in 2023), which inflates the year-over-year comparison base a little. As things stand, for the company, we’re in Q2-26.
A little spoiler up front: no important accounting subtleties and no shady behavior from the company.
5.1 The Income Statement
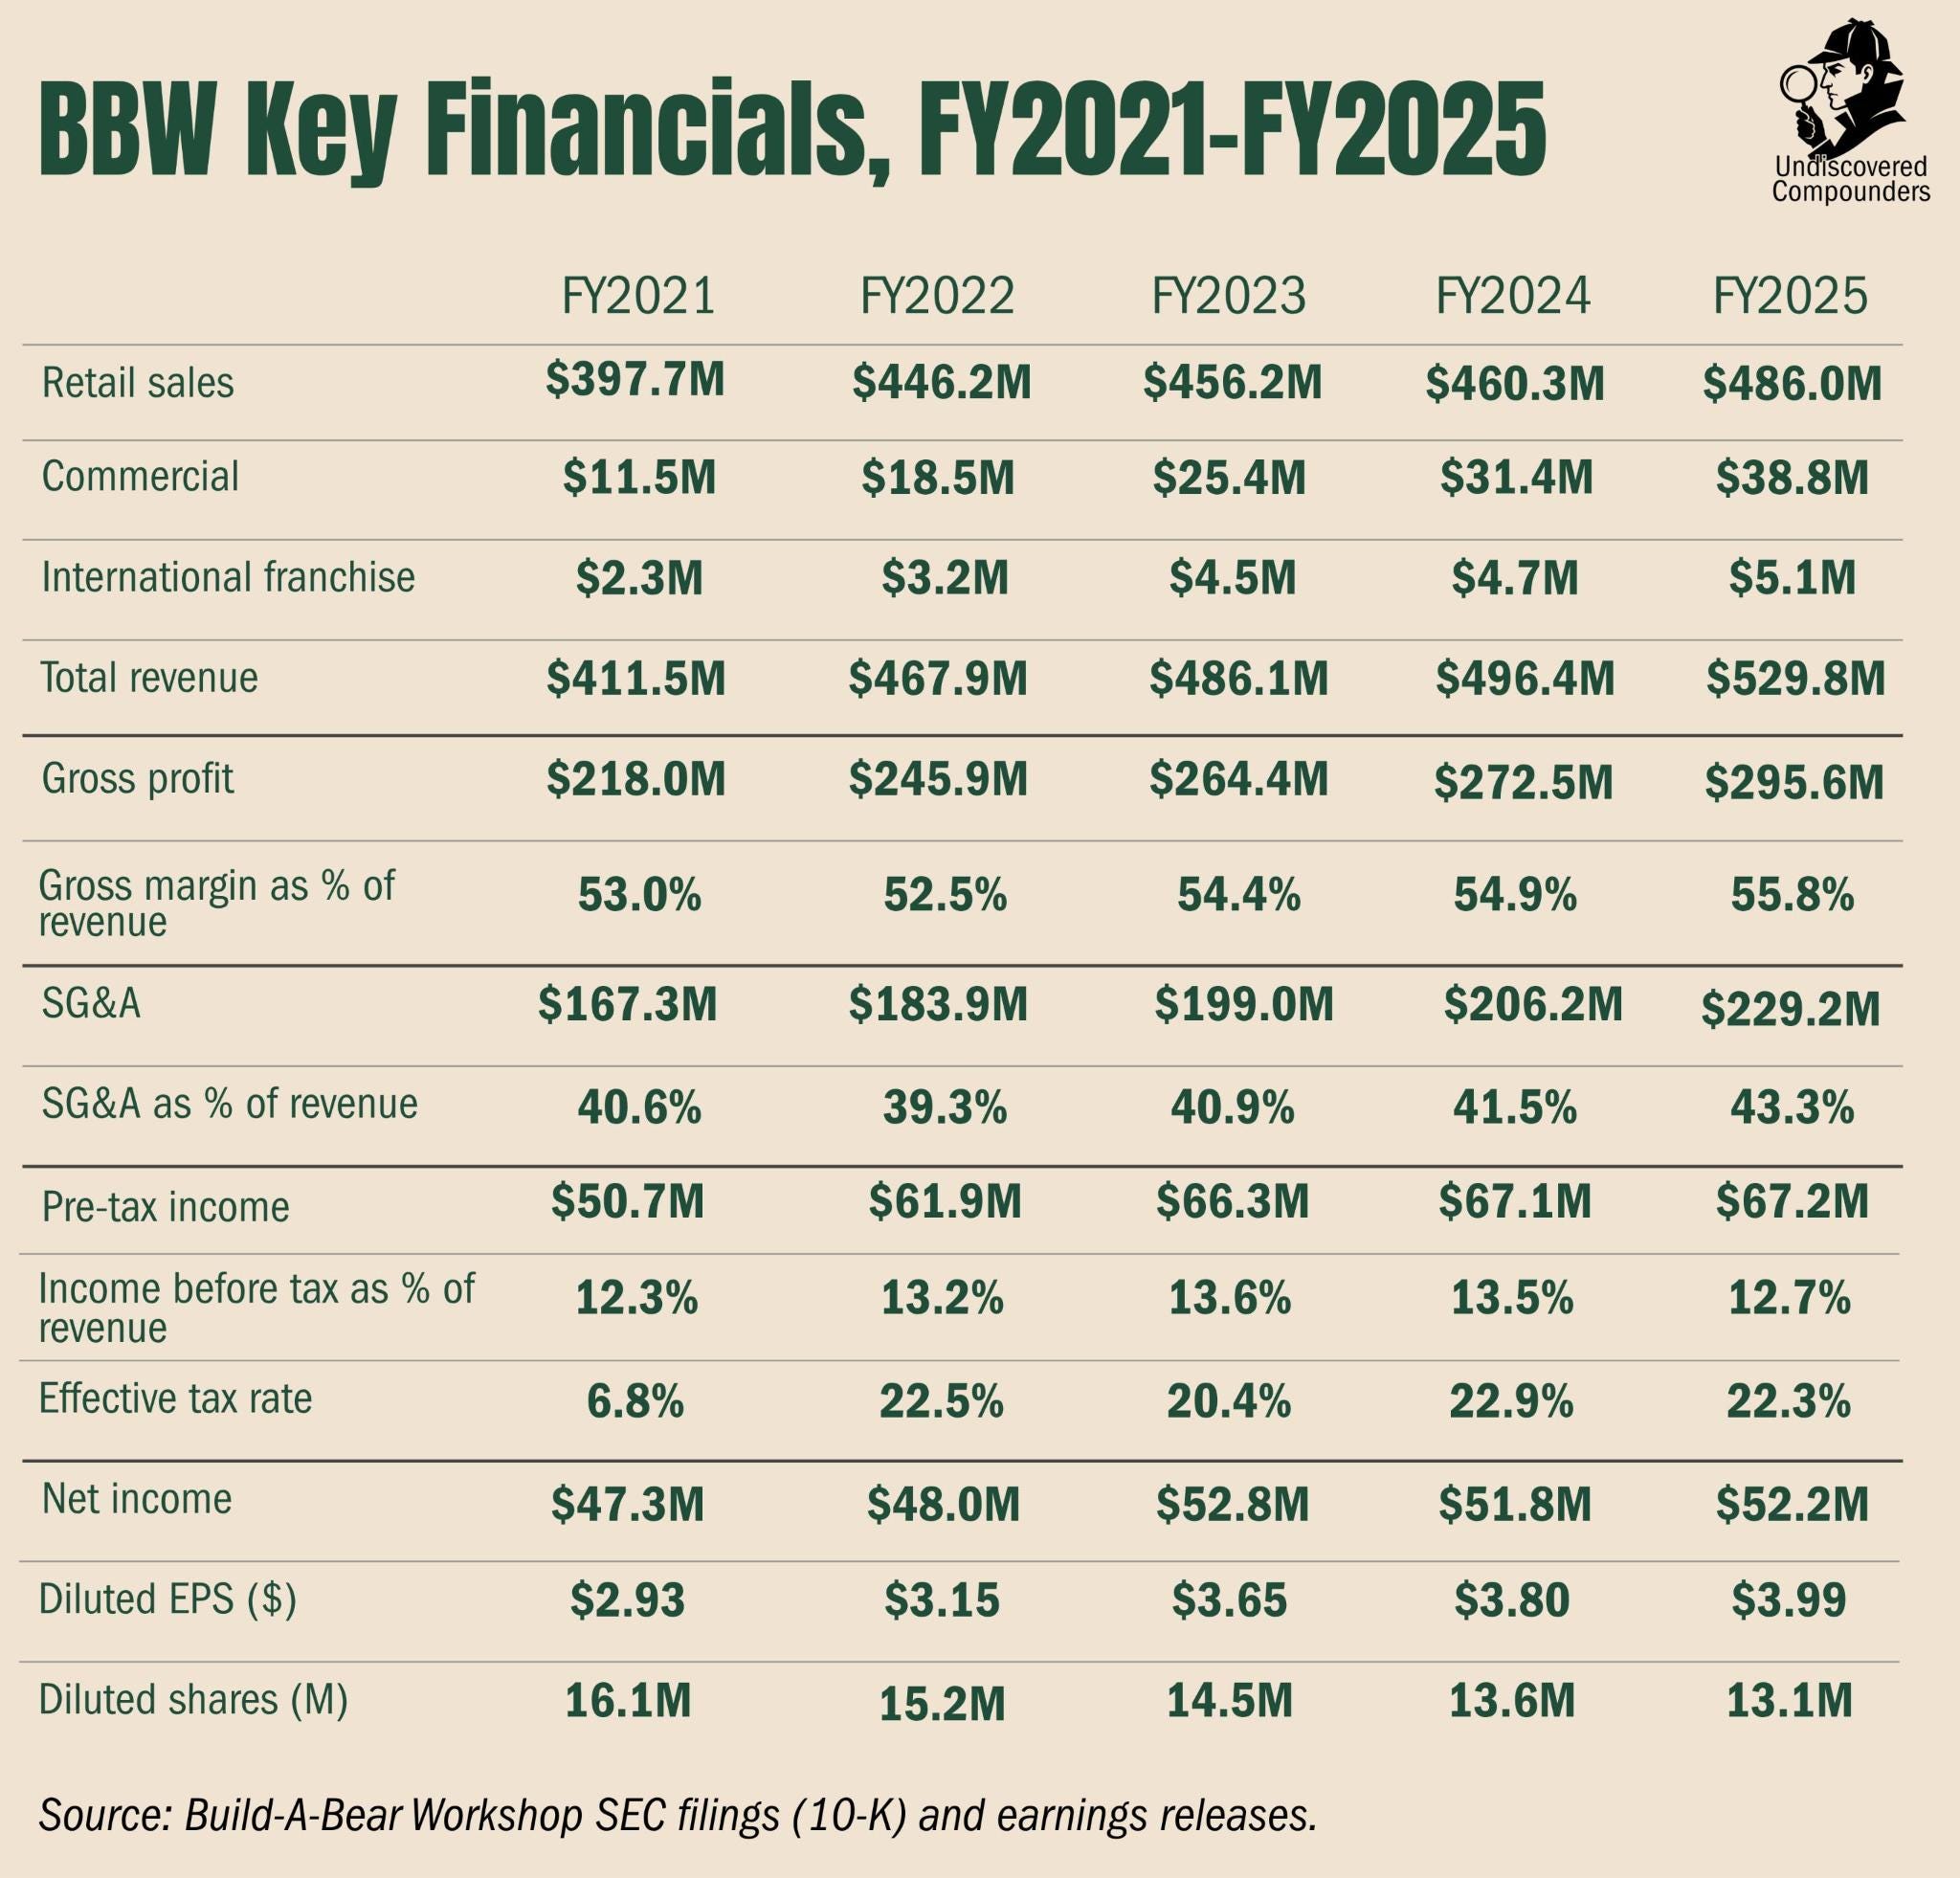
FY2023 had 53 weeks. Pro-rating it down, 2023 net income is $51.8M on a 52-week basis. Don’t forget it.
What jumps out is the stagnation in net income around $52M since FY23, despite 10% revenue growth over the period.
To understand it, you have to pull the accounting thread.
Gross margin. One quirk for the DTC (most of revenue): it includes merchandise costs, but also store occupancy cost (including depreciation and impairment), royalties, tariffs, warehousing and distribution expenses. All wages sit in SG&A (which can flatter gross-margin comparisons with competitors). It rose 1.4 points over the period, and in fact it has risen every year since Covid. Note too that tariffs already had an impact in FY25. First point, the company has an ability to raise prices, small but steady, in a period when inflation was running above its historical levels. That’s a real edge for a retailer with thousands of competitors (from the restaurant to Hasbro). All well and good, but above all it doesn’t explain why net margins stagnated.
The tax rate. It’s always above 22% from 2022 to 2025 (2021 was a Covid-related exception), except in 2023 when it’s 20.4%. That gap comes from a one-off tax benefit tied to a return to profitability in the UK, which allowed past losses from UK asset writedowns to be deducted. Had the tax rate been 22% in 2023, net income would have been $51.7M and would have followed the same ordering as revenue (a record every year through 2025). Nice, but adjusting for tax, net income stagnates even more around $52M.
Pre-tax income. A clear improvement from 2022 to 2023 (+7.2%), a modest one from 2023 to 2024 (+1.2%), and a trivial one from 2024 to 2025 (+0.1%). The stagnation shows up here too, so the explanation has to be in SG&A.
SG&A. Simple: it has offset gross margin by a bit more every year since 2023. It went from 39.3% in FY22 to 43.3% in FY2025. +1.3 points a year on average. So that’s where the problem comes from, but SG&A is too big a bag. We need more granularity, and for that you have to look at Note 15 of the 10-K:
Selling expenses directly tied to the segments: the majority, roughly the costs of the stores (minimum-wage increases, promotions, and so on) and of DTC e-commerce. These went from 28.0% in FY23 to 30.2% in FY25 (as a share of DTC revenue). About 60% of SG&A.
Unallocated corporate overhead: basically, SG&A expenses not attributable to a segment. These went from 13.8% in FY23 to 15.4% in FY25 (as a share of total revenue). About 40% of SG&A.
Let’s focus on the total contribution of the 3 segments, that is, how much each segment brought in subtracting only the expenses specific to each (leaving aside the costs common to all 3): you see an increase of $10.7M (from 137.3 to 147.9). This is the metric management uses to make its capital-allocation decisions. I want to be sure I’ve been clear enough, so let me restate it. From FY24 to FY25, the contribution of the 3 segments rose $10.7M (each segment’s revenue minus its own costs). Over the same period, corporate overhead rose $10.5M.
Segment growth was eaten, within $200k, by the growth in head-office costs, that is, everything not specific to a segment (pre-tax lands at +$0.1M, so the rest is trivial). I haven’t seen this mentioned in any of the analyses I’ve read, even though management has spelled out that it decides based on these numbers.
To sum up:
From 2023 to 2024, net income didn’t move because of a lower tax rate in 2023.
From 2024 to 2025, net income didn’t move because management reinvested all of its operating gains into its own structure.
The question left is whether these costs are a new cost floor or a transitory investment.
The market seems to price the first, but I think the reality is more nuanced. First point, they’re opening their new flagship store in Orlando in 2026. That store has been in the works for years, and part of these costs very likely corresponds to one-off costs tied to preparing the opening. Second, management has spelled out that it hired talent that falls into this corporate overhead. That talent is a form of investment. It may be a new floor, but we can expect a return on the investment in that talent. For the rest, it's speculation, but it’s quite likely that part of these costs simply becomes a new floor.
That leaves the very bottom line, earnings per share, which reconciles everything. It compounded at 8% since 2021 despite the flat net, because the company bought back about 19% of its shares in 4 years. We’ll come back to it in the management part.
5.2 The Segments: Two Companies, One Multiple
Here too we’ll put ourselves in the same decision frame as management. It focuses on contribution margin by segment (the segment’s gross margin, minus the selling expenses directly attributable to it).
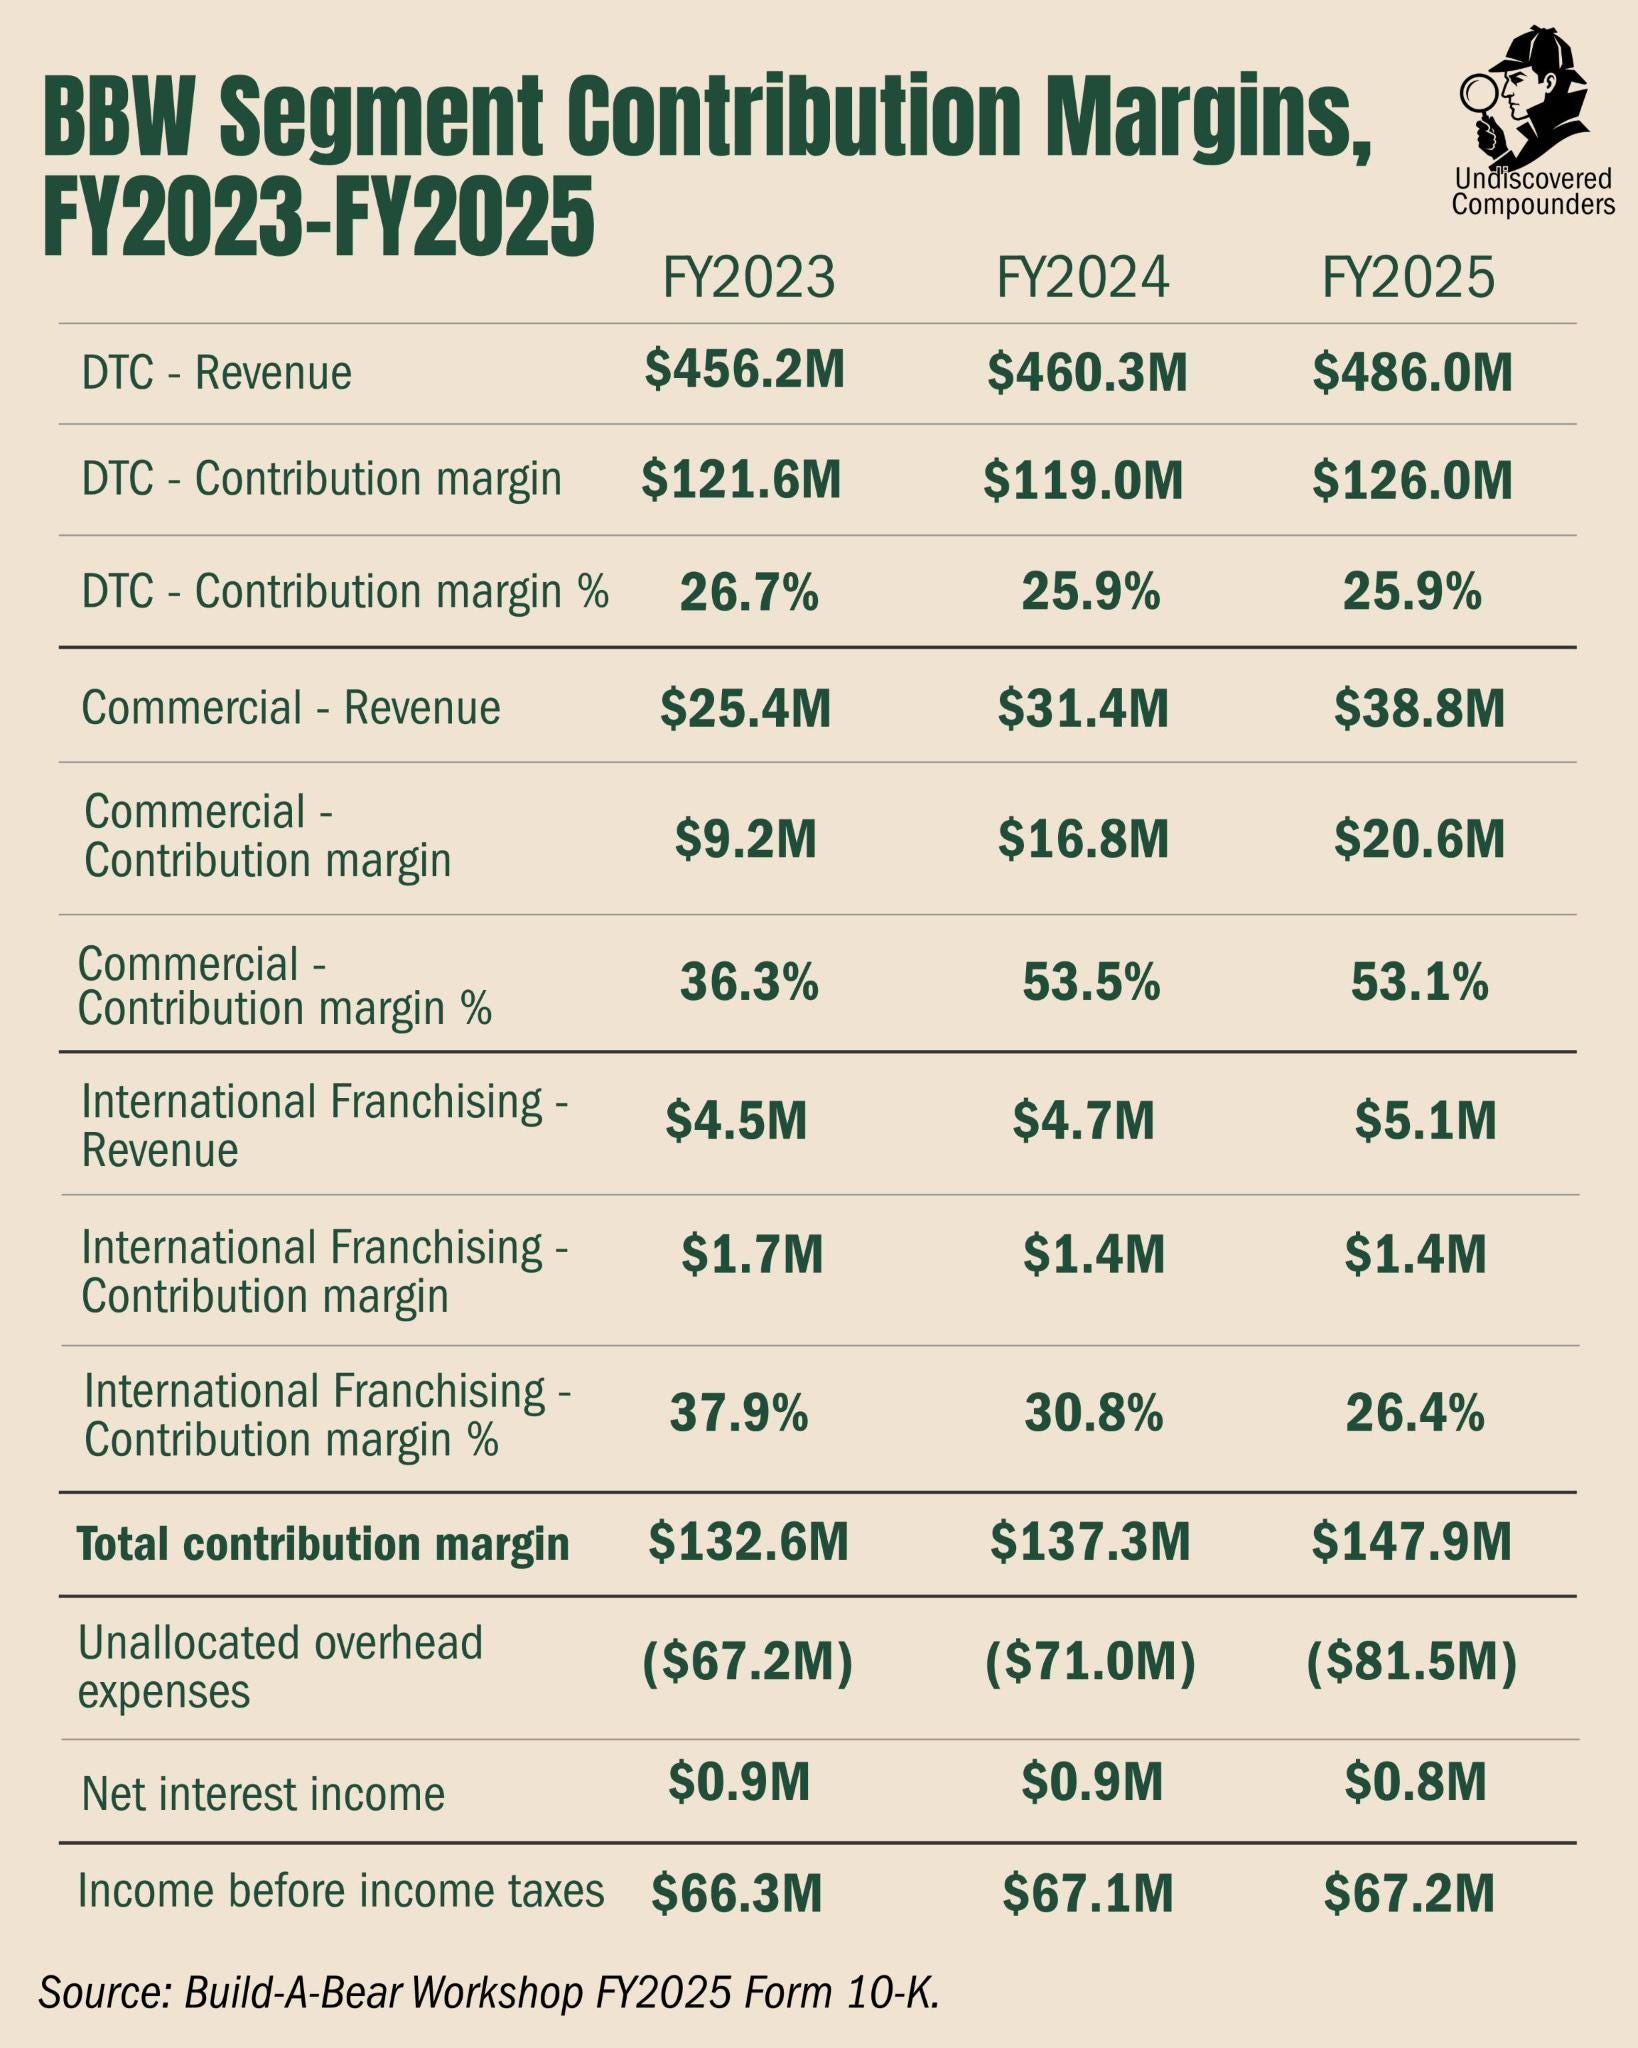
DTC (stores plus web) puts up a 25.9% contribution margin and grows about 6% a year. A good retailer, capital-intensive, paying rent, salespeople, and inventory. Commercial (wholesale, outbound licensing, entertainment) puts up 53.1% and grows 23.5%. Twice the margin, four times the growth.
Where does the gap come from, when the two show roughly the same gross margin (DTC 56.1%, commercial 55.6%)? From everything commercial doesn’t carry, which is a lot. No lease, no sales team, minimal marketing, and above all zero incremental capital: it’s the partner (Walmart, the zoo, the cruise ship) who runs the point of sale and carries the inventory, or the licensee who makes and sells it themselves.
The royalty and the wholesale drop almost naked to the bottom of the segment. DTC, on the other hand, pays the whole list above for every dollar it takes in. Result: commercial is 7.3% of revenue but 14% of total segment contribution, and above all, it alone provided about a third of the contribution growth between FY2024 and FY2025. On 7.3% of revenue. That’s enormous. There’s the engine I mentioned in the short thesis, in numbers.
Let’s temper that a bit.
One. This is still a fairly recent cruising speed, and it varies with management’s choices. In FY2023, commercial contribution topped out at 36% ($9.2M out of 25.4), weighed down by $4M in direct costs (the cost of Build-A-Bear Entertainment content and a film released in 2023). The 53% of FY2024-FY2025 is the real pace, but a studio that reinvests can pull it back down. One to watch. I think management won’t take risks on that side until they have a bit more visibility on the current risks (the focus of the next part).
Two. A pure license would put up a 90% gross margin. At 55%, it’s mostly the wholesale taking over. The royalty layer on top remains a minority.
Three. Above all, contribution margin excludes corporate overhead (whatever isn’t attributable to a specific segment). In reality, both engines (DTC and commercial) “free-ride” on the same structure and the same brand, which come in part from that $81.5M of corporate overhead.
Four. Timing. This segment adds $3 to $4M of contribution a year. The headwind (tariffs + overhead) takes out 10 to 16. The engine is still too small to cancel the headwind in the short term, but it improves the quality of the mix, well hidden behind the flat net income. It’s a non-problem for a shareholder who digs and who sees this 7.3 P/E as an opportunity. If the trend holds at 23% (the current pace), commercial reaches a third of group contribution in 7 years and parity with DTC in a decade.
The March 2026 Walmart wholesale (1,500 stores) is a wildcard, maybe the wildcard (the old Walmart partnerships like a little BBW stand inside the store aren’t counted here). On assumptions of $15 to $30M in revenue, with a margin heavily shaved by Walmart, say 35% rather than 53%, that’s $5 to $10M of contribution, half the current commercial segment from a single partner, with a template that can extend to other mass distributors. Keep this in mind, because it’s one of the most important variables for the bull case.
5.3 The Balance Sheet and the Flows: The Capacity to Wait
Time to prove that the balance sheet pays you to wait.
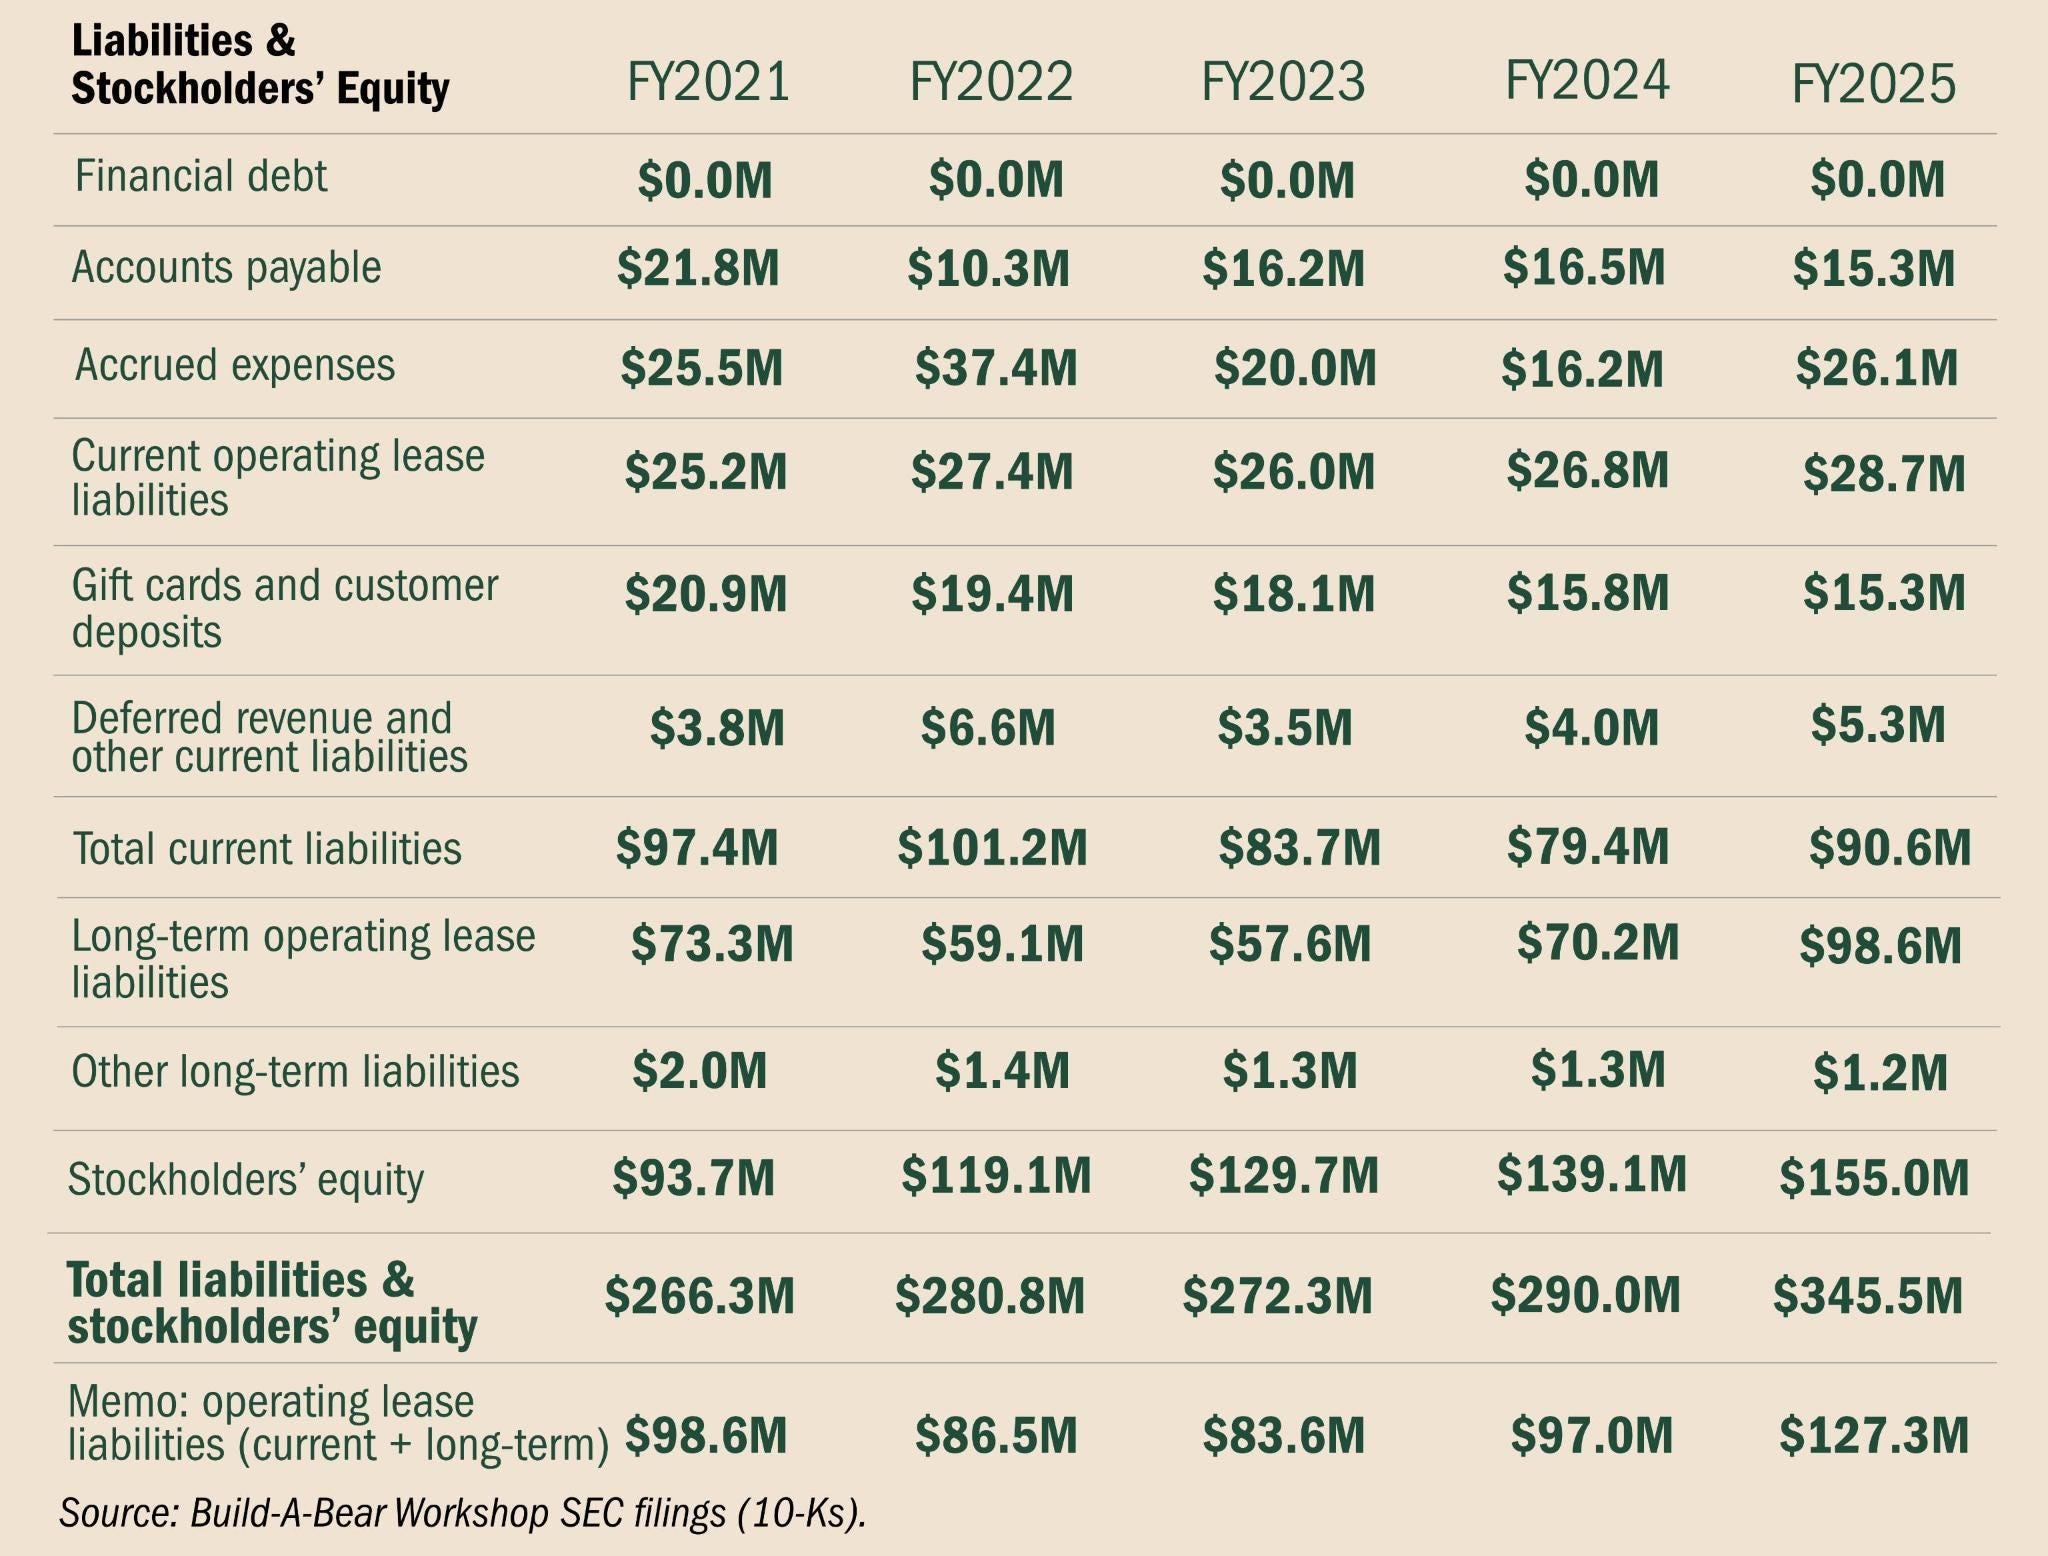
The simplest fact, and the most important: zero borrowing. No financial debt on the balance sheet, at any period close. The only thing that resembles it is $127M of lease liabilities (the fixed minimums capitalized under ASC 842), and on top of that, part of the real rent stays variable, indexed to store sales and expensed as it goes: when a location slows, part of its rent slows with it. A cost structure that breathes with activity, set on a debt-free balance sheet. There’s the starting point of this capacity to “hold out a long time.”
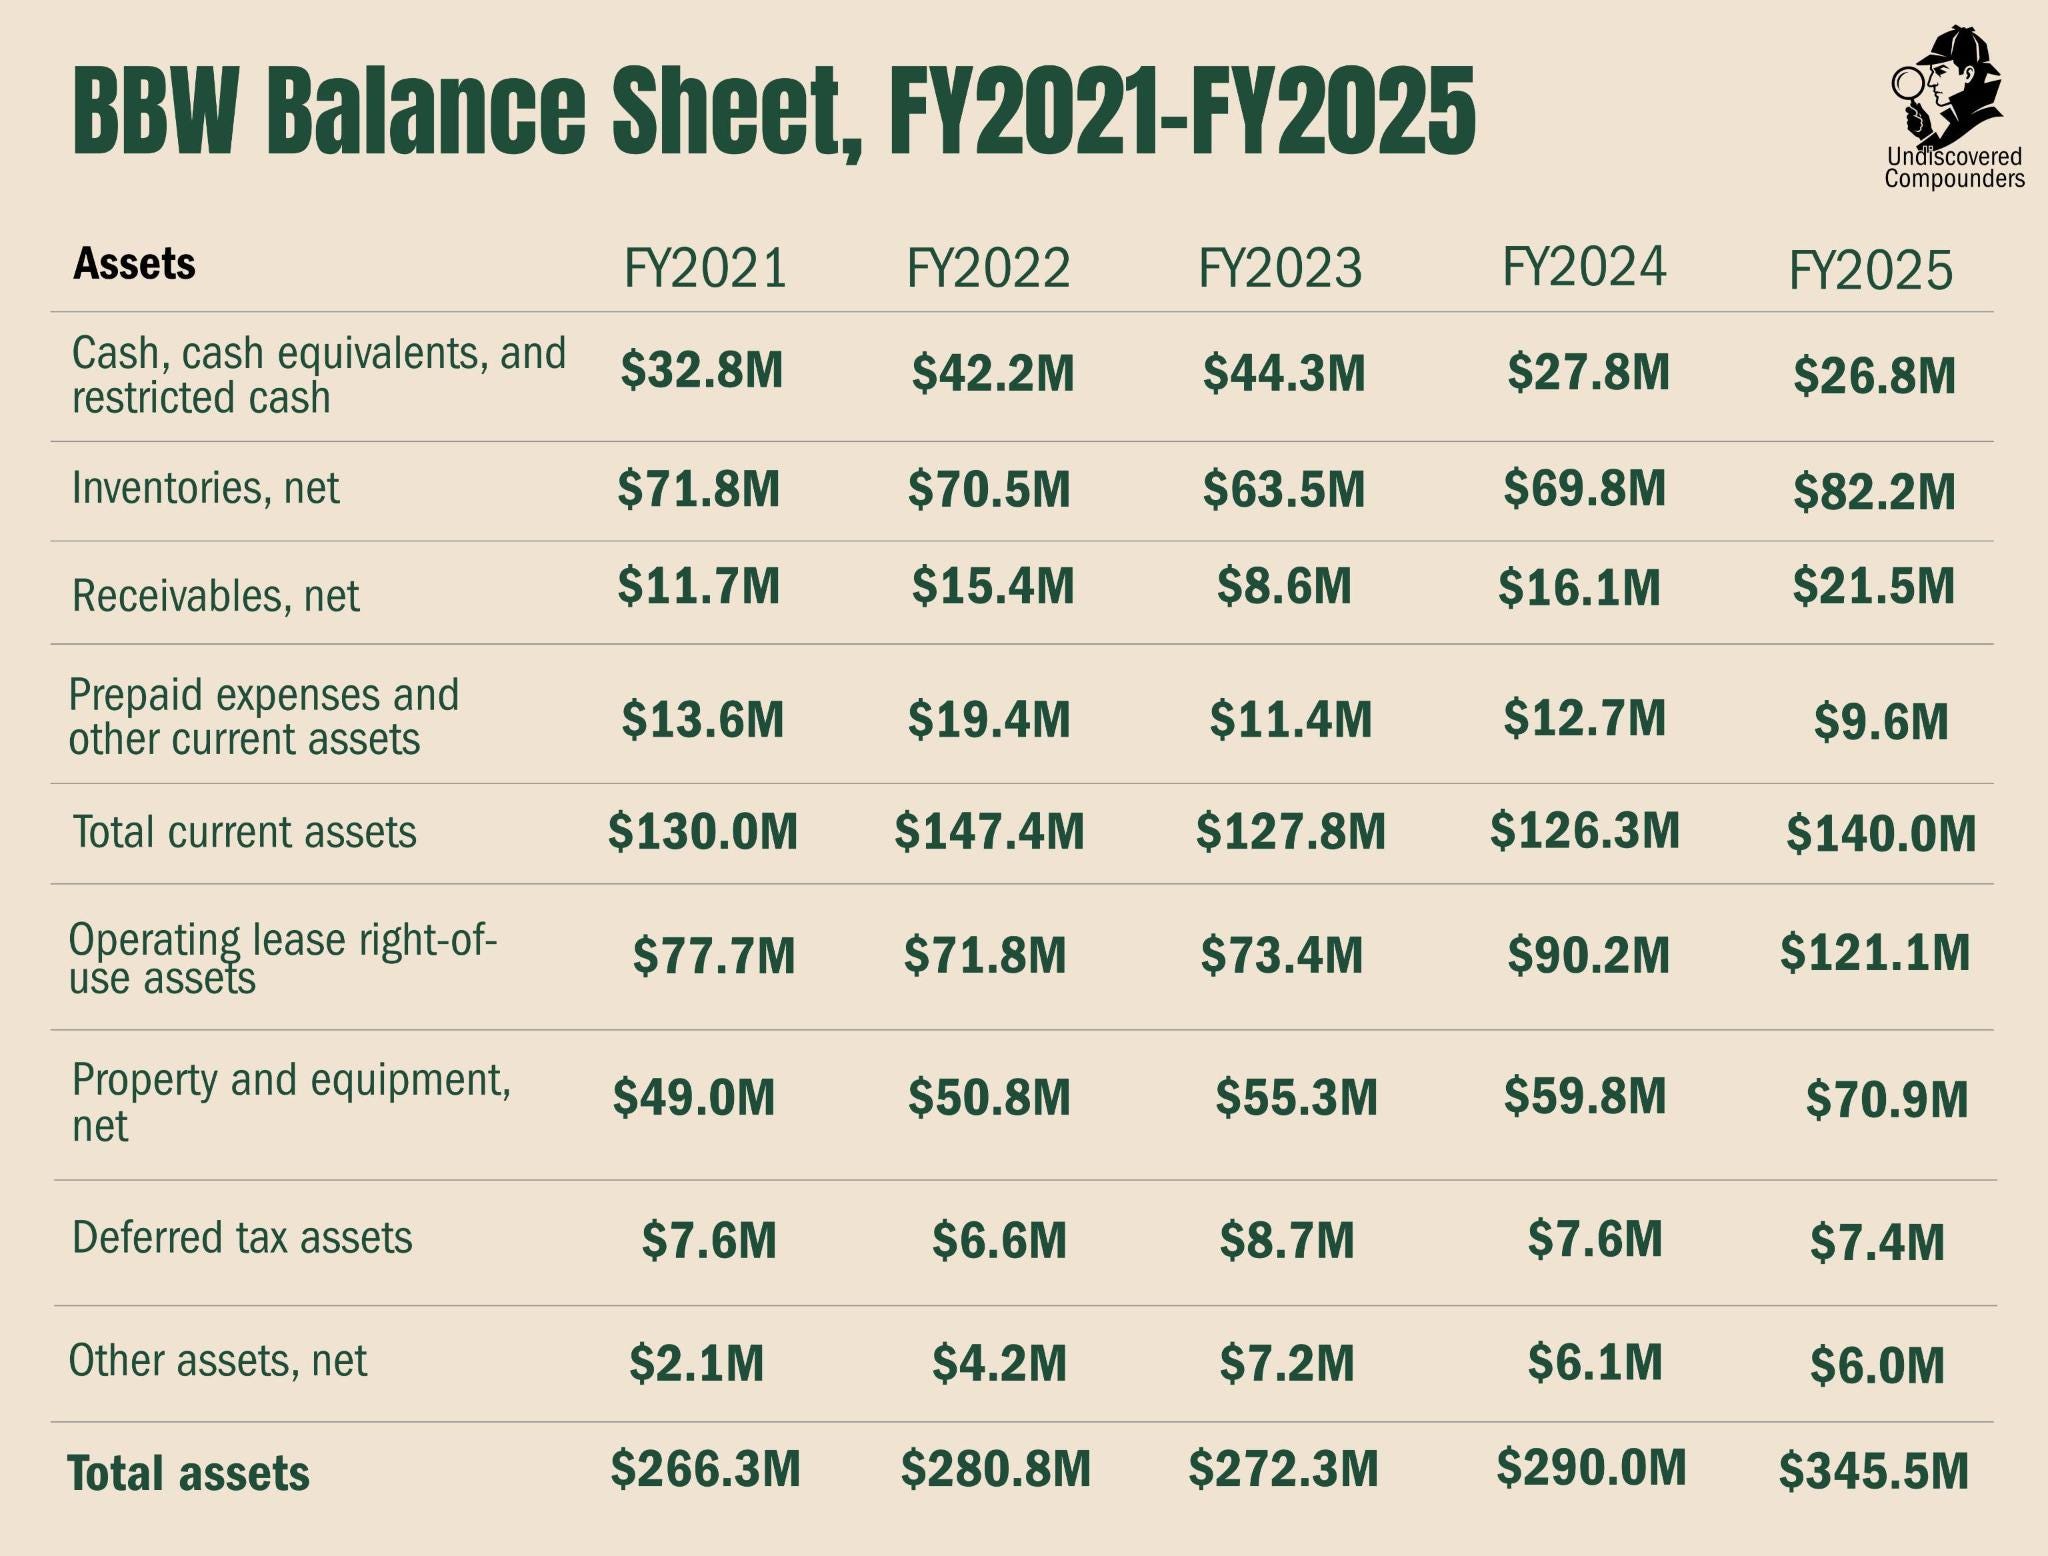
Next, of course, the cash. BBW isn’t sitting on a war chest. $26.8M of cash at the end of FY2025 is modest. It’s a leftover from the Kanen period, which convinced management to spend the $75M of cash that was lying around at the time on buybacks. The fortress is in the cash-flow generation and the absence of debt, coupled with an undrawn $40M revolver, signed late 2025 and running to 2030. Just in case. In case of what, I don’t know. It was raised from $25M to $40M in 2025. I won’t say it’s a sign of potential M&A, but the increase is curious all the same. The stash itself is thin, and will stay that way as long as the company doesn’t see financial trouble ahead. BBW’s strength is in its flow rather than its reservoir.
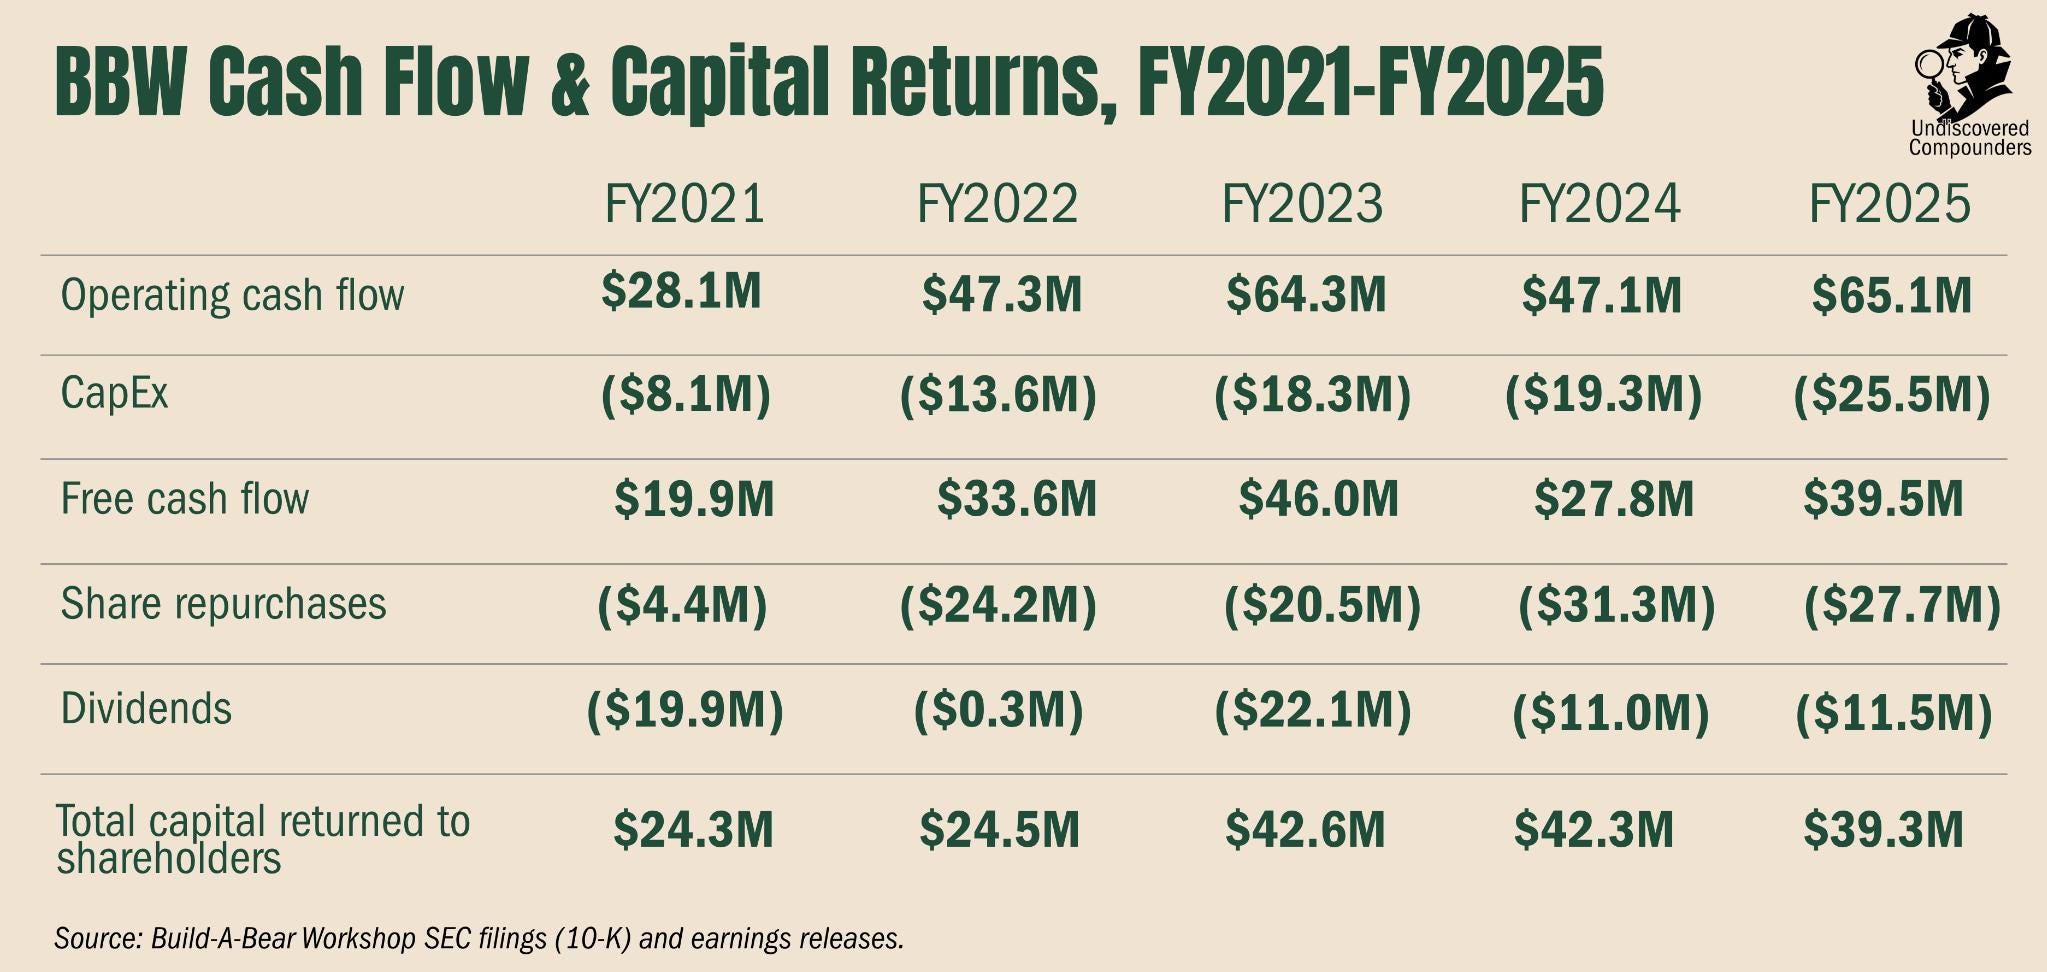
Here’s the flow: operating cash that swings between $47 and $65M depending on the year. Note that the $47M low is due to a tariff-related inventory pre-buy (working capital swallowed the rest). CapEx climbs from $8 to $25.5M with the pace of openings, IT, and above all the Orlando flagship. FCF runs around $40M, excluding exceptional CapEx.
What does this flow go to. Returns to shareholders, all of it. From 2021 to 2025, the company generated $167M of FCF and distributed $173M to shareholders ($108M of buybacks and $65M of dividends). The small $6M gap was drawn from cash. $173M returned to shareholders in 5 years, and the company is currently worth $392M.
Of course, if the company needs this flow to deal with a tough situation, the reallocation will happen instantly. As for investments, that seems unlikely to me. Management has shown little appetite for them, and since the Kanen episode, the company is very focused on returning value to shareholders (given how the stock has behaved since, you can see why).
As long as the machine holds, and it holds comfortably for now, the arithmetic of buying back at 7.3x is almost absurd, in a good way. There’s currently $47M left authorized on the program. At $31, that’s about 12% of the float. A company retiring 5 to 6% of its shares a year, at 7.3 times earnings, near its low, mechanically turns every year of waiting into value per share. Time is the ally of good businesses.
A few special mentions on the balance sheet and cash flows, just in case:
The roughly 18% inventory increase in FY25 is tied to tariff-related pre-stocking. Beyond that, it’s not operationally informative.
Receivables, up 33%, come from the $13.2M tariff refund booked as a receivable from the government, and partly from the rise in wholesale/commercial, which naturally carries B2B receivables where DTC collects cash/card directly. Nothing operationally significant beyond that.
Only $0.4M of cash is restricted out of the $26.8M.
When I say no debt, I mean financial debt. The lease is a form of debt, but it’s built directly into the business model. The whole analysis of the capacity to wait rests mainly on financial debt and FCF, so leases are barely relevant to the reasoning.
The significant rise in net PP&E in FY25 is primarily driven by leasehold improvements on new store openings and the ongoing Orlando flagship buildout.
The $70.9M of property, plant and equipment includes the wholly owned distribution center (valued at $31M a few years ago).
No goodwill, no defined-benefit pension plan, and no material litigation or significant provision.
The move in cash from $44.3 to $27.8M (from FY23 to FY24) corresponds to some buybacks and a special dividend. Everything for the shareholder. Thanks, Kanen.
5.4 Return on Capital (ROIC)
For a retailer like BBW, the most faithful metrics would be everything that touches operations directly: comparable store sales, ATV, and so on. Management has unfortunately become stingy with that kind of information over the last few years. So we’ll have to rely on accounting measures, biased as they are.
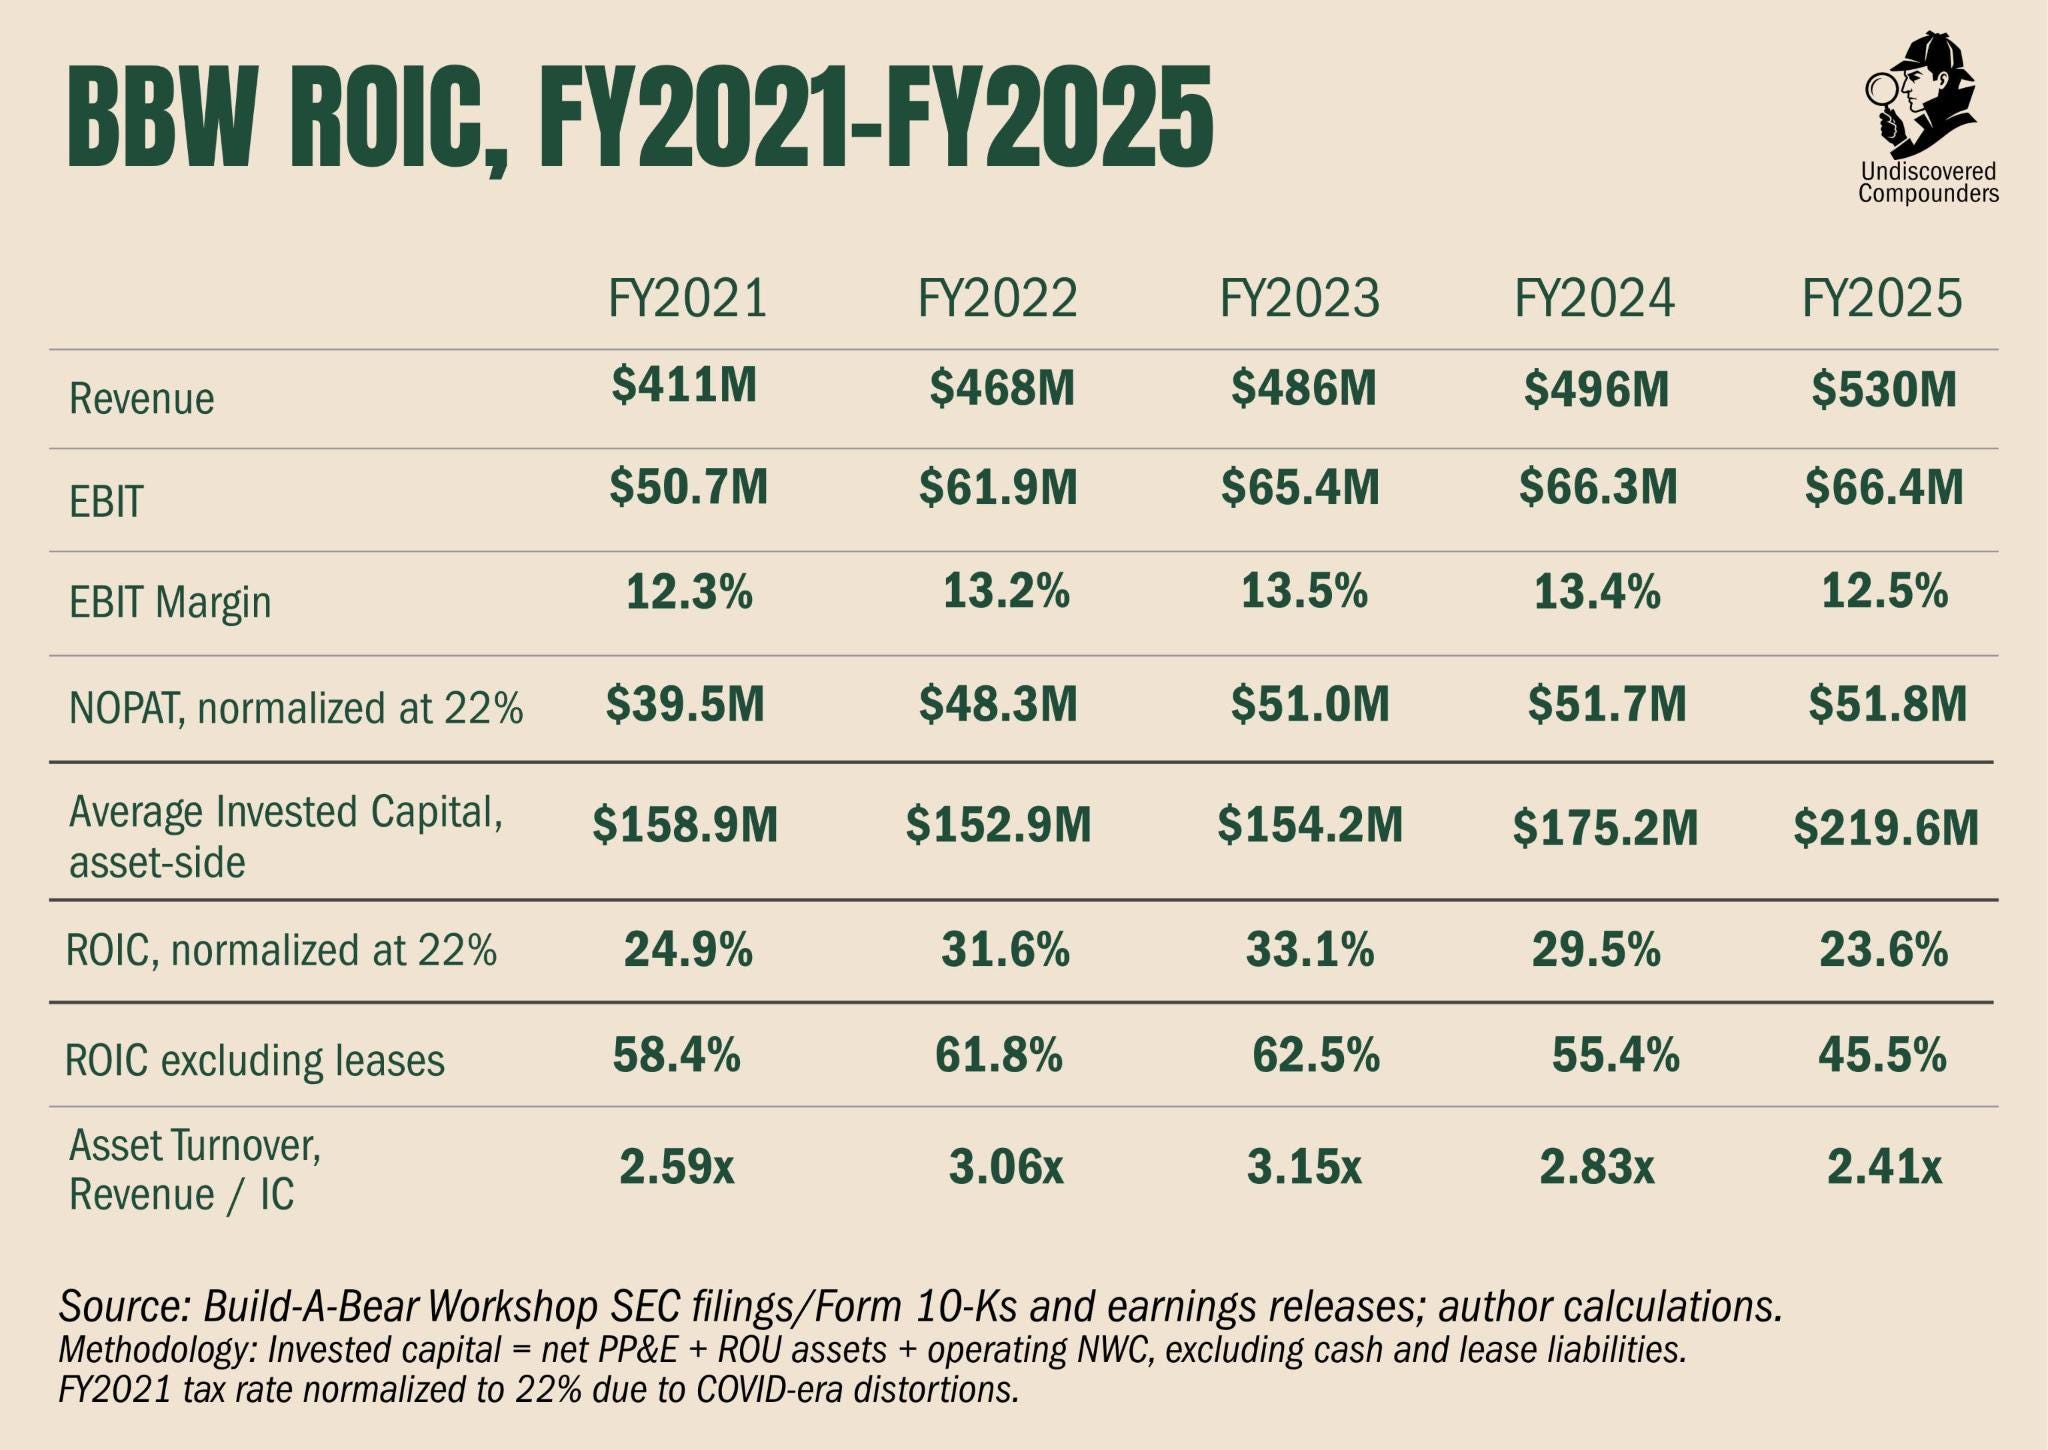
In two years, ROIC went from 33.1% to 23.6%. Yet the company improved operationally. So either the P&L is lying or ROIC is. Here it’s ROIC, more precisely the denominator. About half of invested capital comes from ROU (right-of-use) assets (31% from NWC and 19% from PPE), basically the accounting capitalization of operating leases under ASC 842. When BBW renews a lease at a higher rent or signs a longer contract, the standard mechanically books it as an asset. To sum up, the denominator jumps while not a dollar of capital is deployed.
When you control for that variable, you still land on a ROIC dropping from 62.5% to 45.5%. So it’s even worse? This time, it’s the numerator lying. FY25 EBIT absorbed about $7M of IEEPA duties (out of $11M total tariff-related costs for the year), struck down by the Supreme Court in February 2026 and being refunded to BBW. A cost the year carried without it being permanent. Adding it back to EBIT, you normalize ex-lease ROIC around 50-51%. As for inventory (+18% in FY25), that’s growth working capital tied to Commercial (+53% over two years), so it’s real capital that belongs in the denominator.
We’re still at the lowest of the last 5 years ex-leases. Here the “culprit” is management, or rather these investments via CapEx (+$7.2M in 2 years). First, the Orlando flagship, weighing on CapEx for 2 years with a sharp acceleration over the last few quarters and an opening planned for H2-26. Then the corporate overhead (mostly FY24 to FY25), weighing on the numerator and corresponding partly to investments and partly to inflation. I can’t strip them out, because they’re expenses directly tied to operations, but for now their impact weighs on both parts of the fraction simply because of timing; if these investments pay off, they should raise the numerator and lower the denominator (mechanically for the Orlando flagship) by H2-26, but probably mostly from FY27 on.
To sum up, ROIC is deteriorating, but a large part is tied to accounting artifacts, and the rest to operational timing. Someone who takes the accounts at face value without really diving in might just see a business whose revenue grows without growing its net income, and that’s getting less and less efficient. BBW’s accounts have screened very badly for 2 years. But a close look at these metrics shows a company whose engine of growth and value creation is gradually reorienting, that holds up relatively easily against a tough macro backdrop, and that should soon reap the fruit of its recent investments.
5.5 The Latest Quarter: Q1 2026 Results
5.5.1 The Quarter Itself
A little detour through the thirteen weeks that ended May 2, 2026, the ones where the stock stumbled. Here we’ll only put numbers to the situation; the full analysis is the next part.
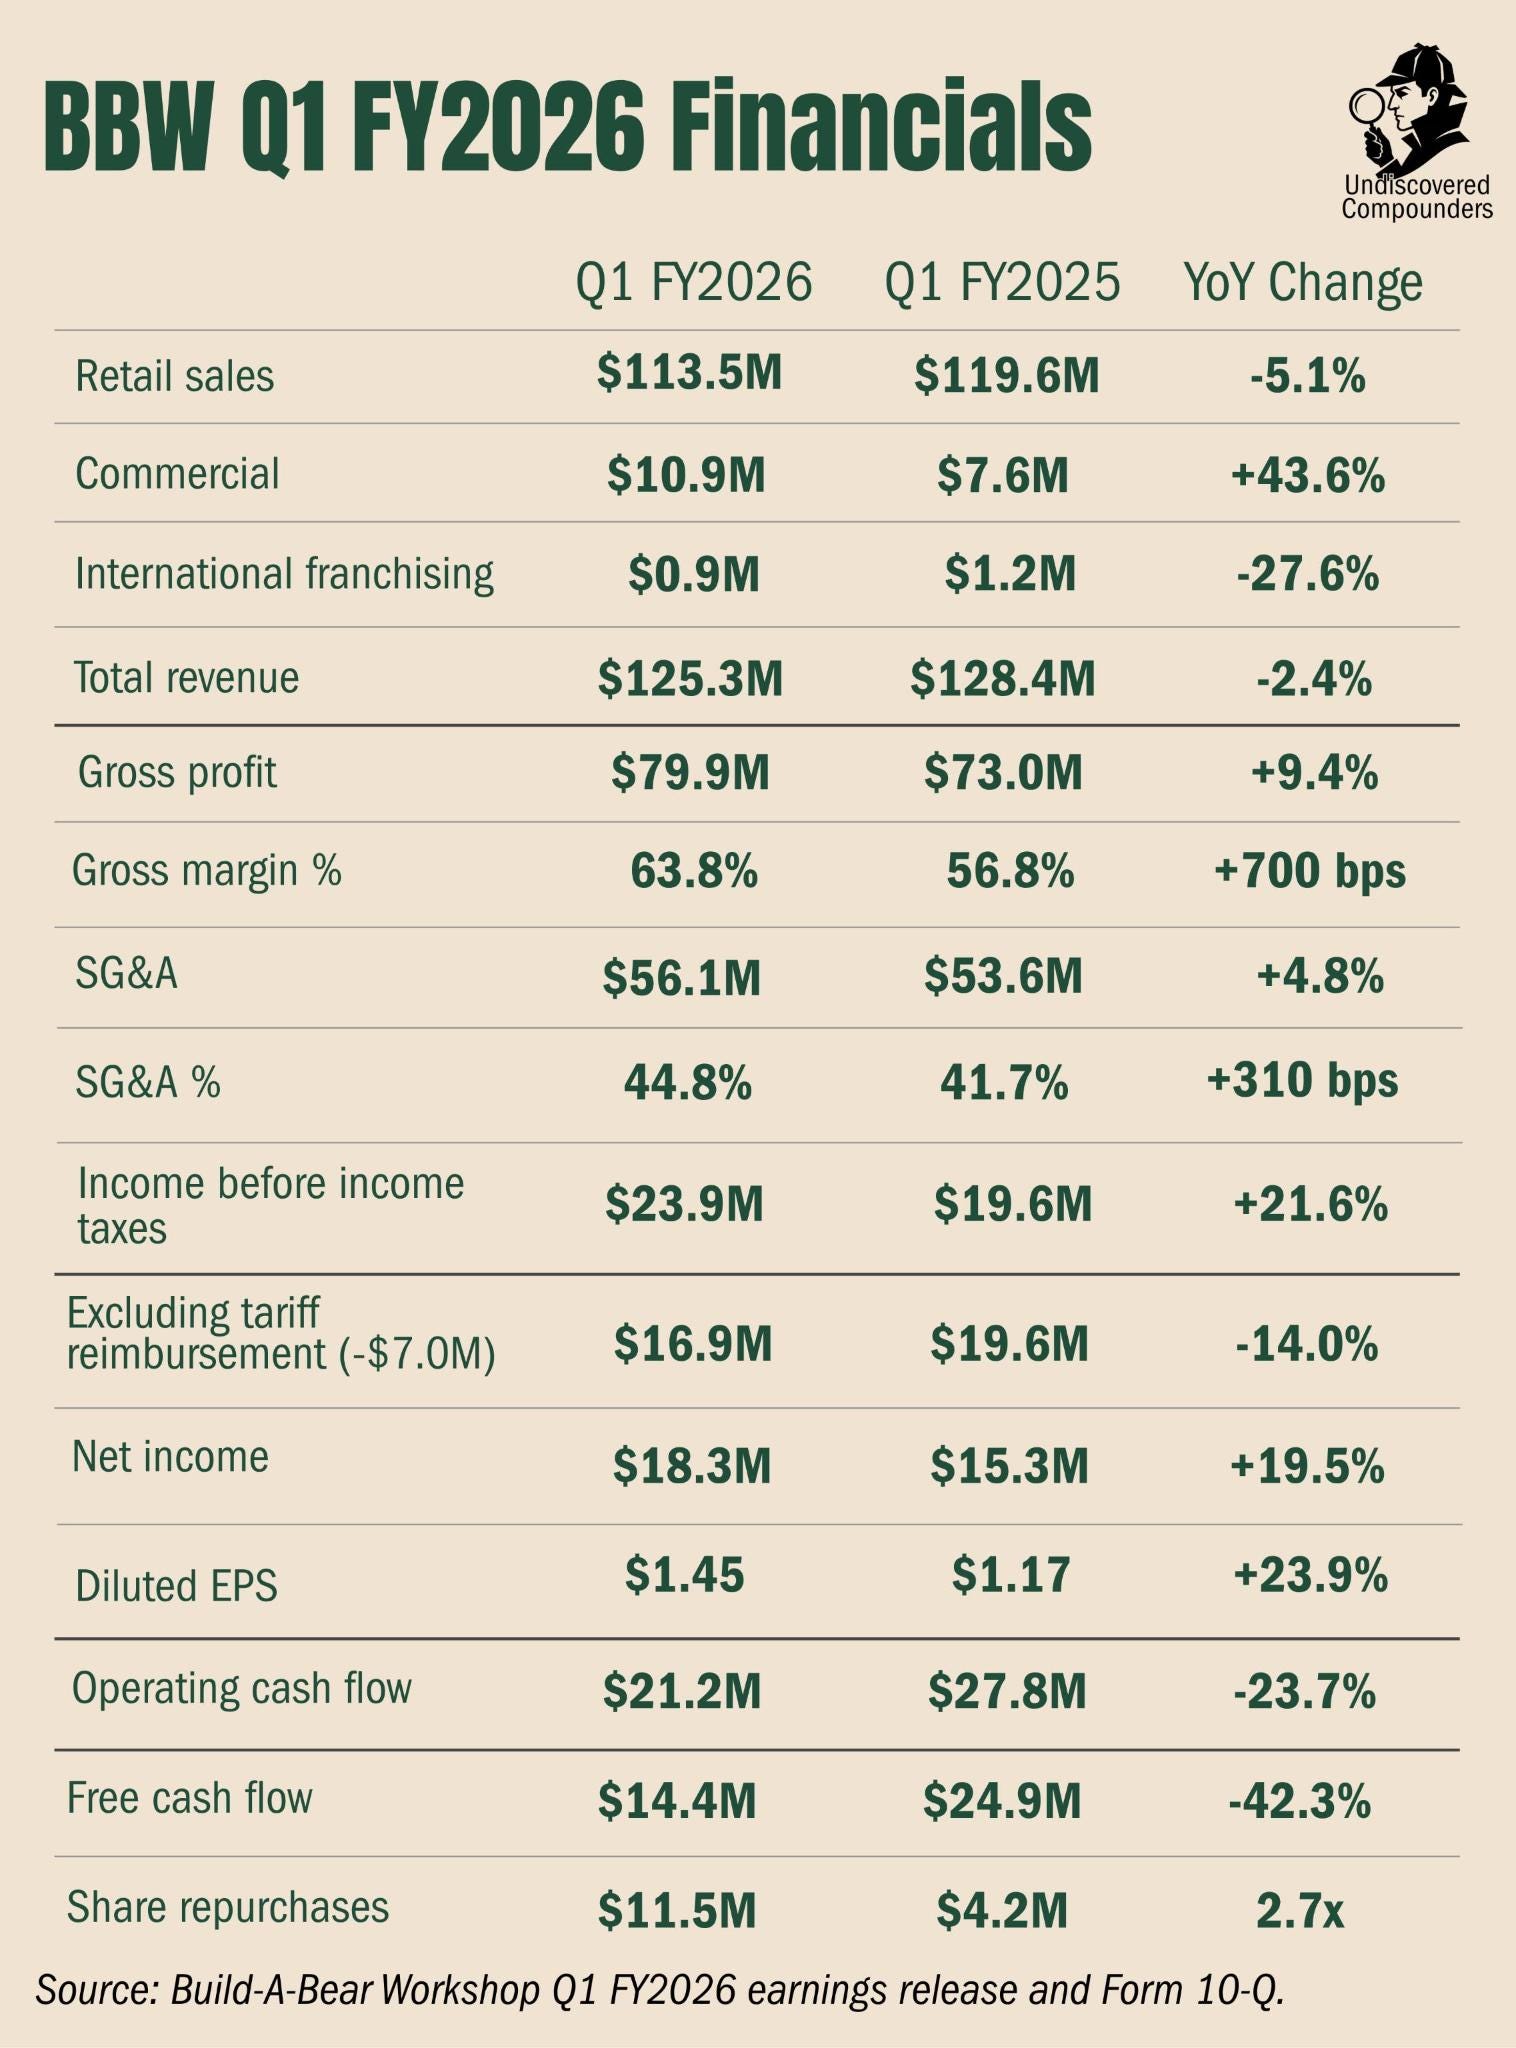
Revenue falls 2.4%, but the information is in the mix: retail loses 5.1% while commercial gains 43.6%. It’s the mechanism shown in 5.2, but sped up. The asset-light model offsets the retail weakness. Note that the Walmart wholesale isn’t yet at its full potential. The coming quarters will say more about that.
Consolidated gross margin gains 700 bps, but that’s essentially an accounting artifact tied to the tariff strike-down and the $7.0M refund booked straight into cost of goods on the quarter. Cleaning all that out, you land on a 58.2% gross margin, 140 bps more. Despite tariffs continuing into 2026, the company raised its margins (after stripping out the refund impact; note all the same the favorable comp effect tied to “anniversarying lower prices last year”).
SG&A doesn’t cheat: +310 bps, but I’m saving it for the next part.
Operating cash fell $6.6M while pre-tax income rose $4.3M, a $10.9M gap. Someone’s lying. In moments like these, always believe what the cash says, as a precaution. Rightly so, because here it’s the earnings that lie.
They include about $7.0M of tariff refund (a one-off). Adjusting pre-tax income for the refunds, you land on $16.9M, a $2.7M drop from Q1-25. Compared with the $6.6M OCF decline, you get a $3.9M gap. $1.7M of that gap is due to the tax on the refund (useless complexity, just know it’s a one-off), the rest is mostly working-capital swings. In short, after a few adjustments, nothing relevant here.
Last point to flag, the company bought back almost 3 times more shares in the period than in the prior quarter. I’m saving the capital-allocation analysis for the management part.
Got something out of this? Restack it, or forward it to the one investor who'd actually read it. That's how the undiscovered get discovered.
5.5.2 Analyzing the Walmart Partnership
This partnership is the most important optionality and one of the essential variables of the bull case. I don’t want to settle for management’s silence to judge it, so I dug a bit while waiting for the next quarter.
Walmart placed “a multimillion dollar wholesale order” with BBW to sell its products directly in its stores (run by Walmart, not a corner of the Walmart where BBW sets up its stand). BBW ships its products, Walmart puts them in its stores, handles everything, and hands BBW its cut. That’s how, from March 16 to May 15, 1,500 Walmart stores saw trend pods filled with BBW-stamped Mini Beans appear, might as well use the brand.
Let’s make a rough estimate of the order’s size. Take the middle of the range: $5M. Assume it covers only the plush (not the derivatives like plush clothing). BBW should make about $2.5 on the plush (sold for about $5 on the shelf). 5M/2.5 = 2M plush. Divide by 1,500 stores and that’s about 1,330 plush per store. Divide by 60 days and that’s about 22-23 plush to sell per day per store, about $110/shop/day. I could be off by a factor of 2 to 3, but it doesn’t change the conclusion: it’s clearly a small test order for Walmart, especially for a collectible.
At the same time, you could buy them directly on the Walmart site: mystery bags, plush packs, collectible sets, and so on. There are a few reviews (the biggest has 44), the vast majority positive. They’re still available on the Walmart site. Residual stock? A top-up of the partnership? Hard to say, all the more since it may not be tied to this partnership directly. Some are on promotion, others out of stock. Here too, it doesn’t really help decide.
I combed social media for more information. First, on the BBW-specific subreddit (mostly collectors and slightly too seasoned parents), reception is positive overall. The vast majority of cases where I saw the brand-dilution-through-Walmart argument were in analyst pieces on the partnership rather than from customers themselves. Positive reception, but nothing showing it reaches beyond the usual BBW sphere. I didn’t see an abundance of content either. The fans liked it. The less-fan-but-still-fond-of-the-brand crowd were pleasantly surprised to see it again in an unexpected place. Influencers made content about it. But no sign of real buzz like there’s been for other BBW successes. Not cold, but not hot either.
In the same stretch, BBW opened a wholesale showroom in Los Angeles and built out the dedicated team. The aim is to land other partnerships with other wholesalers. You don’t build a showroom on a failure, but the silence caps the odds of a total success:
“In the first quarter, we expanded the team for this important strategy and opened a new Build-A-Bear showroom in Los Angeles to help serve our wholesale account base. This is partially based on the confidence from the recent launch into 1,500 Walmart locations featuring our popular Mini Beans collection.” (Conf Call, Q1-26)
While I was at it, I analyzed secondary-market price trends, but nothing significant there either. Prices remain close to in-store prices (not always easy to judge, since in-store prices themselves vary). Here too, it’s not negative, but you can’t claim it’s positive. Which is the perfect conclusion for the analysis of this partnership. Keep it in mind for the valuation part.
We’ve finally laid all the groundwork we need; we can finally get into the important part. The one that justified these 10,000 words. Don’t worry. There are still 15,000 left before we can decide whether the bet is worth it, why, from what price, and under what conditions.
6. The Crux: The Bear Case and the Four Risks
6.1 The Four Problems
Let’s set the scene again:
US consumer confidence was at its lowest in decades, with a slight uptick in the latest data, thousands of stores closing, an import cost no one can pin down at twelve months, and a consumption shift toward experience.
Build-A-Bear posts its fifth straight record year, its biggest sales day in history on Valentine’s, and guides to do it again. It opens franchised stores abroad. It buys back its shares and pays dividends on a balance sheet built to hold. Big but: in the first quarter, it flinched.
This section focuses on that flinch and its implications for the future.
Let’s size the problem. In Q1-26 (ended May 2), revenue falls 2.4%, to $125.3M; retail sales give up 5.1%, and domestic traffic drops 7%, after outperforming the national trend for 2 years while the national numbers were falling. It’s a surprise to management too, which had guided “roughly flat.” Management pins the shortfall on a “broader macro shift,” cuts its revenue forecast for the year, and warns the second quarter will be weaker still. Pre-tax income rises, but that’s misleading: excluding the $7M one-off tariff refund tied to the prior year, it falls to $16.9M adjusted, down from $19.6M last year. The business itself is shrinking. To sum up: a real revenue drop, a real operating miss, and a cut guidance.
We’re done with the branches, on to the roots. I’ve flagged the 4 problems that, to me, could justify a problem in the business, at least on the surface. On their importance, I ranked them by their impact on the last quarter (Q1-26). From most to least important:
Falling in-store traffic. In Q1-26, domestic traffic fell 7%. That figure is worse than the national trend, after 2 years of outperforming that trend all through the down cycle.
A total shift in marketing. In late 2025, Google pushes its AI-generated answers more aggressively to the top of search. As a result, organic ranking collapses. As a result, free traffic to buildabear.com melts away. It’s a broad trend: on queries topped with an AI answer, the organic click rate drops from 1.41% to 0.64%.28 Meanwhile, US organic search traffic falls 2.5% year over year29, and zero-click heads toward 70% of queries.30
Customs tariffs. BBW imports everything from abroad: 51% from China and 44% from Vietnam. Management guides for about $10M in net cost over FY26. Beyond the amount, it’s the uncertainty that’s the problem.
Wage inflation and SG&A overall. In Q1-26, SG&A goes to 44.8% of revenue versus 41.7%, or +310 bps.
We’ll spend the next half hour of reading sizing, working through, and quantifying the impact of all these problems.
Before we start: in my reading of analyses of the company, I came across, more than once, two problems cited as major ones that, to me, don’t deserve the title at all. I mention them here to head off future questions:
Competition from Pop Mart’s Labubu and from Blind Boxes in the Kidult sector (collectors especially). This is objectively wrong. Yes, there was clearly a mania around the products in 2024-2025 (Pop Mart did a 20x in 1 year), but not only has interest in Labubu dropped sharply since (Bloomberg is already talking bubble bursting31), the secondhand resale prices have collapsed.32 In any case, the competition was largely in the e-commerce segment, which is still the minority part of DTC. False problem and false consequences.
Offsetting the drop in organic traffic (2) would supposedly have a decisive impact on SG&A (4), and BBW would have to “fix marketing to fix its margins.” This is largely incorrect, with the numbers to show it. But the explanation needs more detail. I’ll come back to it in point 2.
Here we go.
6.2 Falling In-Store Traffic
Over the 2 years the confidence trough was forming, BBW’s traffic had beaten the national. As recently as March, the company described its 2025 performance as “outpaced the national average” and ended the year barely down (less than 1% while the national benchmark lost about 5%, Conf Call, March 12, 2026). In Q1-26, while BBW loses 7%, US retail traffic is positive, around +1.7% in March, the sixth straight month of gains.33 In one quarter, the gap flips: from about four points above the national to eight below.
So the problem seems to belong to BBW alone. Really? As is often the case, the reality reads between the lines.
Most of the hole comes from existing stores (-$7.5M), while recent openings recover a good chunk of it (+$3.5M). Everything else (closures, FX, gift cards, and so on) counts for almost nothing. Meanwhile, the average basket rises, driven by units per transaction and a few well-placed price increases. The diagnosis is clear: fewer visits to existing stores.
Okay. The comp first. Q1-25 was the biggest quarter in BBW’s history: double-digit growth, rising margin, and traffic carried by launches that crushed it with teens and adults. The last two years benefited from a string of collector drops that fed those records. Q1-26 doesn’t get a product release like that, but is still compared against it. The same volatility that put BBW above the national now puts it below, once you compare.
If it’s a question of release timing, is it temporary? According to management, yes. The bulk of the releases is loaded into the second half. I’ll spare you the plush collections hiding behind that “loaded calendar,” but note also, even mainly, the opening of the Orlando flagship in the second half, the company’s biggest store. The business is inherently lumpy; the first-half dip looks a lot like a hole in the schedule, and that’s management’s view: "Retail segment performance will remain back-half weighted in 2026." (Conf Call, Q4-25)
Okay, the comp was tough, but there’s a real story behind it. Teens and adults are the cohorts that dropped off most. If you’ve followed along this far, you probably guess why: e-commerce. As a reminder, the site is a storefront for collectors that makes them want to go to the store (sometimes out of pure desire, sometimes for an in-store exclusive), and that traffic got cut by Google’s zero-click. We’ll cover it next, but the idea is simple: everything is connected.
Another point, minor but it had an impact, the weather: “severe weather across large portions of the country.” Management had sized such a shortfall at $2M, but for the prior quarter (January’s weather).
Finally, of course, the macro backdrop. We covered it in depth in part 3. Let’s quickly recap the conclusions:
Sentiment is far more pessimistic than behavior
The impact is felt much more on replaceable physical objects than on the experiential
A few signs of improvement are taking shape.
Even if the cycle drags on, BBW is equipped to survive, both on its balance sheet and on its P&L, with growth abroad.
Surviving isn’t enough for us. What’s the probability the damage is significant for BBW if the cycle drags on or even worsens? Based on all my assumptions and calculations, I estimate the probability of a net-income decline at 15.0% or more to 24.4%, with a 2-sigma confidence interval. Ah, if only... I do have a hunch, but it doesn’t count. The only things I can use are the present and tests for the future.
For one, Valentine’s 2026 was the best revenue day in the brand’s entire history. When marketing matters less, customers still show up at BBW. Easter held the comp against last year. The Frosted Animal Cookies collection (the things you end up writing as an investor...) sold through in under 2 weeks. Above all, right after the new collection launched (March 2026), management was already noting a “trend change” in traffic. The schedule-hole thesis looks more plausible than a demand problem.
To find out is simple. The second half sees BBW’s 30th anniversary, the Harry Potter series release, the other collections, the Orlando store opening. The comps aren’t as tough for Q3 and Q4. If, despite all that, second-half traffic stays below the national average, the schedule-hole hypothesis is eliminated. Note that Q2 suffers largely the same problems as Q1, hence the focus on H2.
6.3 Clickocalypse: AI Search and E-Commerce Traffic
(The word isn’t mine: management dropped it on a conf call, borrowing an industry term. When management names its own problem, you might as well take it seriously.)
Let’s lay it out properly. Since Google started answering directly at the top of the page, the free click to merchant sites has collapsed. Sharon sizes it at “double-digit impact to the direct click-through… from organic search” (Conf Call Q4-25). The desire to buy hasn’t moved: when the customer arrives, they convert and spend more, basket and units up. It’s a discovery problem: the flow of strangers who used to land on buildabear.com via a search.
E-commerce demand falls 26.1% in Q1-26, after -13.6% in Q4-25 and -5.5% across 2025 as a whole. Not only is the decline significant, it’s accelerating. It's bounded, though: the direct revenue impact is only $2.9M less, versus the $6.1M drop in net retail. E-commerce is still the minority part of DTC, but as we said just above, e-commerce works to send flows back to the stores, so this hole in e-commerce hits harder than the $2.9M.
That said, AI isn’t entirely to blame; management admits it delayed e-commerce upgrades while migrating its legacy inventory system (Conf Call Q4-25), against a backdrop of tough license-launch comparisons. So the -26% inflates the real structural hole attributable to Google.
The question left is who takes the hit. BBW is structurally better sheltered than its competitors. Luckily, we already have a fair amount of data on the topic. AI devours informational traffic and long-tail sites, but it barely touches the navigational/transactional. Short queries, like “build a bear,” trigger an AI answer only 8% of the time, versus 60% for questions.34 AI coverage of e-commerce actually fell year over year, from 27% to 18.5%: Google protects purchase intent, where it monetizes (it also has to compete on the effectiveness of its search engine and AI’s impact on it). Over the period, the biggest sites gained organic while the tail lost it.35 And buildabear.com’s traffic runs precisely on direct and on the typed brand name, so these are queries AI barely touches. Add the retailtainment base, where most sales happen in store, brand recognition for eight in ten Americans, an owned customer base you re-engage without paying anyone, and 1,500 Walmarts where discovery is physical, filtered by no algorithm. Management says it better than I do:
“We’re actually very well suited for what is expected to be the positive attributes of the brands… One is that you’re a strong branded company, so people are really looking for you and your brand. One is that you can create unique and engaging content. Another is that you have the ability to speak directly to your consumers… we have, like, an 80% capture rate at our stores… so we can send them direct emails.“ (Conf Call Q4-25)
Digging through the old conf calls, you read that this isn’t the first time the problem shows up. Back in 2024, web traffic had clearly dropped off, attributed to a fall in organic search amid competitive conquesting. A few quarters later, traffic back and “improved organic search results” (Conf Call Q2-24), via an SEO overhaul and a better product calendar. The volatility of online distribution is recurring here; it’s a near-constant game of adaptation, and the team has already proven it knows how to adapt. I’m still surprised, though, that e-commerce investments in 2024, notably the arrival of a Chief Customer & Digital Officer and a Chief Revenue Officer, led to such a clickocalypse impact over two quarters, accelerating. It’s clearly a problem that mustn’t last, or it calls management’s operating quality into question.
Let’s get to the false problem I mentioned in this part’s intro. A recent analysis claimed SG&A margins were BBW’s main problem and that to fix them, it had to fix its marketing and its reach problems via Google. The idea was that to maintain its retail growth, BBW has to offset the loss of the free internet-search lever through SG&A. To me that’s an analytical error. On paper, the analysis can look right: SG&A rose to 44.8% in Q1-26, versus 41.7% a year earlier. But the analysis falls apart the moment you break down the increase:
“SG&A expenses were $56.1 million or 44.8% of total revenues, compared to 41.7% last year. Higher wage rates and investment in talent, followed by general inflationary pressures and timing of longer-range investments, all contributed to the 310 basis point increase.” (Conf call, Q1-26)
Not a word about marketing. This margin problem is more a reflection of the fourth problem mentioned above than of customer-acquisition cost, all the more so given what we just covered in this subsection. One point can be conceded: part of the “talent” mentioned refers to talent recruited precisely to deal with, among other things, the clickocalypse. But these salaries are on the order of a hundredth of a margin point, at most a tenth. You objectively can’t call that BBW’s main problem.
Management is in fact guiding toward a reallocation of marketing rather than an increase, with less organic and more direct contact. “There will be a decrease in our SEO spend and an increase in direct marketing” (Conf Call Q4-25), paired with an upgrade of the product schema for AI engines, email, and social. A big part of this shift costs very little when the brand does the work in place of the budget: the Frosted Animal Cookies collection generated nearly 0.25 billion media impressions in a week, largely in earned content (Conf Call Q4-25), and its PR approach topped PR Newswire’s March releases “due to its ability to catch both eyeballs and AI agents” (Conf Call Q1-26). Content is now optimized as much for the AI as for the customer.
Here too the problem isn’t as bad as it looks, but it's real. I see two big unknowns.
The first is a question of speed: BBW will adapt to AI search, the only question is how fast versus its competitors. The second is a question of amount: how much extra SG&A to hold DTC growth. It’s possible the analyst from earlier is right, but only in the future. For now that doesn’t seem to be the case, and the power of the BBW brand makes the probability of a truly significant impact (several basis points) fairly low.
Let’s still assume it costs 3 points of SG&A margin. The TTM cost would be $16.2M. Let’s not assume DTC revenue rises thanks to that SG&A spend (even though that’s its reason for existing). Alongside that, BBW is still a company growing double digits in its Commercial and International Franchising segments at higher margins. It’s also a company with a strong brand that has the ability to raise prices (and exercises it). That probably won’t offset $16.2M, but at least half is entirely plausible.
All of this rests on the present problem. But woe to anyone who underestimates the impact, and above all the evolving impacts, of AI on just about everything. Everything can change very fast, for better or worse. And this Google click problem could be nothing next to a risk caused by some new AI feature in a few months or years. That risk is quantifiable neither in probability nor in the force of its consequences.
The only thing I can say with certainty is that today, the Google click problem has a real, bounded impact, one management has a strategy for and is in the middle of deploying, with weapons many of its competitors don’t have, partly offsettable, with a brand power that makes a bleed of several margin points very unlikely. At 7.3 times earnings, this risk alone doesn’t justify the multiple.
6.4 Tariffs, Ô Tariffs: Supply Chain and Pricing Power
BBW imports nearly all of what it sells: 51% from China, 44% from Vietnam. And until 2025, it cost nothing extra (plush came in duty-free): “toys prior to this situation were tariff-free. This was just not something that we really had to deal with” (call Q4-25). The “tariff” line fell as if by magic from the regulatory sky. Exactly the kind of cost a slightly too nervous Mr. Market loves to extend in a straight line.
On February 20, 2026, the Supreme Court struck down the entirety of the IEEPA tariffs. The refund was already covered in the accounts section. Let’s just recall it’s an expected $13.2M refund, nothing that really concerns us for the future except that it flattered the comps and, above all, that it’ll muddy future comps. In the same move, BBW brought its 2026 estimate down from $16M to about $10M. Speculating on the tariffs themselves would be a waste of time. The only thing worth our time is how management can respond, and how it has.
In 2025, BBW absorbed $11M in tariffs ($0.65 of EPS) and still posted a record pre-tax of $67.2M with gross margins up on the year. The shock was absorbed and the business improved. As mentioned above, BBW used its moat: selective price increases on the most in-demand products, pushed above the gross line. In Q1-26, ex-refund, retail gross margin gains another 190 bps, “primarily driven by selective price increases” (10-Q).
The main problem with tariffs is the uncertainty they create: “we’re not talking about just tariff rates going up and down. We’re talking about tariff rates changing from country to country on some monthly basis” (Sharon, Q4-25). And it’s not over.
Today’s 10% comes from a temporary surcharge put in place hastily after the Supreme Court decision, expiring around July 24, 2026. No one knows what will replace it. The Court of International Trade (CIT) even struck it down on May 7, 2026, a decision immediately appealed. The administration is already turning to a more durable lever aimed at China (Section 301), and two such investigations name Vietnam specifically. The Vietnamese rate, down to 10%, could therefore climb back toward the 20% it showed before the ruling. On the refund side, these are just receivables on the balance sheet whose timing depends on the US Treasury. In short, the uncertainty cuts both ways: the tariff can keep falling or snap back up, and BBW can’t build its plan on either. The only certainty, the show must go on.
As we saw earlier, these tariffs are offset by growth in commercial and franchises. And these segments are not subject to tariffs: “Inventory held for our international corporate and partner-operated stores is not subject to tariffs” (Q4-25). The fast, high-margin segments, commercial and franchise, ship from Asia to other countries, outside US customs.
Does the $10M/year cost, offset by the brand’s pricing, partly dodged by the asset-light mix, and whose first nuisance is unpredictability rather than amount, help justify a multiple of 7.3 times earnings? No. Certainly not. The last problem, on the other hand...
6.5 SG&A and Margins
I said I ranked these problems by order of impact on the last quarter. So it comes last. But to me it’s the most significant long term, and the one that most easily supports a bear case. Yet it’s rarely mentioned. By management or by analysts.
Pro subscribers can skip this section and jump straight to the full report below. Signal doesn’t wait.
Behind the wall is the part you came for: every remaining risk and the weight I give it, the valuation model, the bull/base/bear IRRs, and the exact price and conditions that would make me a buyer. Plus every deep dive I’ve written, and every one still to come.
I’m not selling a portfolio and a track record. A track record is mostly survivorship dressed up as skill, and it reverts to the mean, if not below it, at the next real bear market. I sell something duller: full deep dives on small and micro caps nobody knows or bothers to understand, and the follow-up after. You pay me to give you everything you need to make your own call.
I’m not done with this name: the next update, with Q2 and the first real Walmart numbers, lands for subscribers. If that’s your kind of research, the button’s right below. On the annual plan, it’s €25 a month. Cheap, for work that pros read.
